This curated collection is part of a broader research endeavor in which data, sonification and design
converge to explore the potential of sound in complementing other modes of representation and broadening the
publics of data. With
visualization still being one of the prominent forms of data transformation, we believe that sound can both
enrich the experience of data and build new publics.
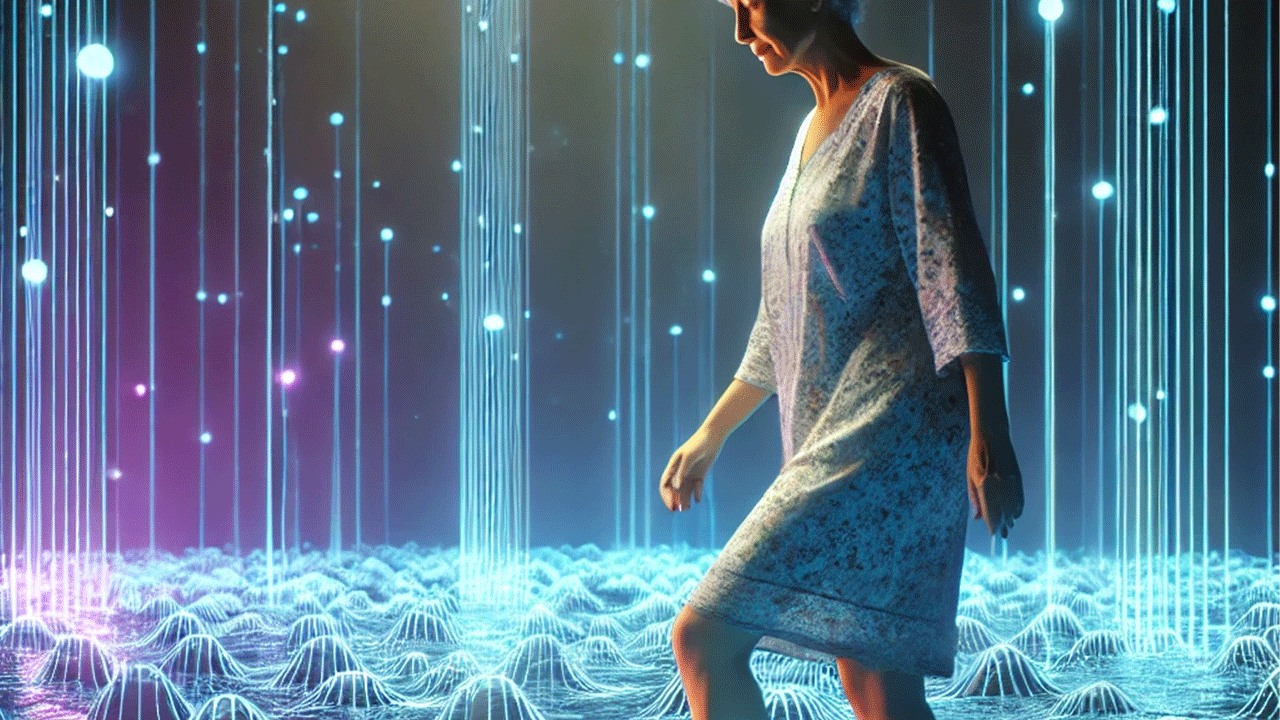
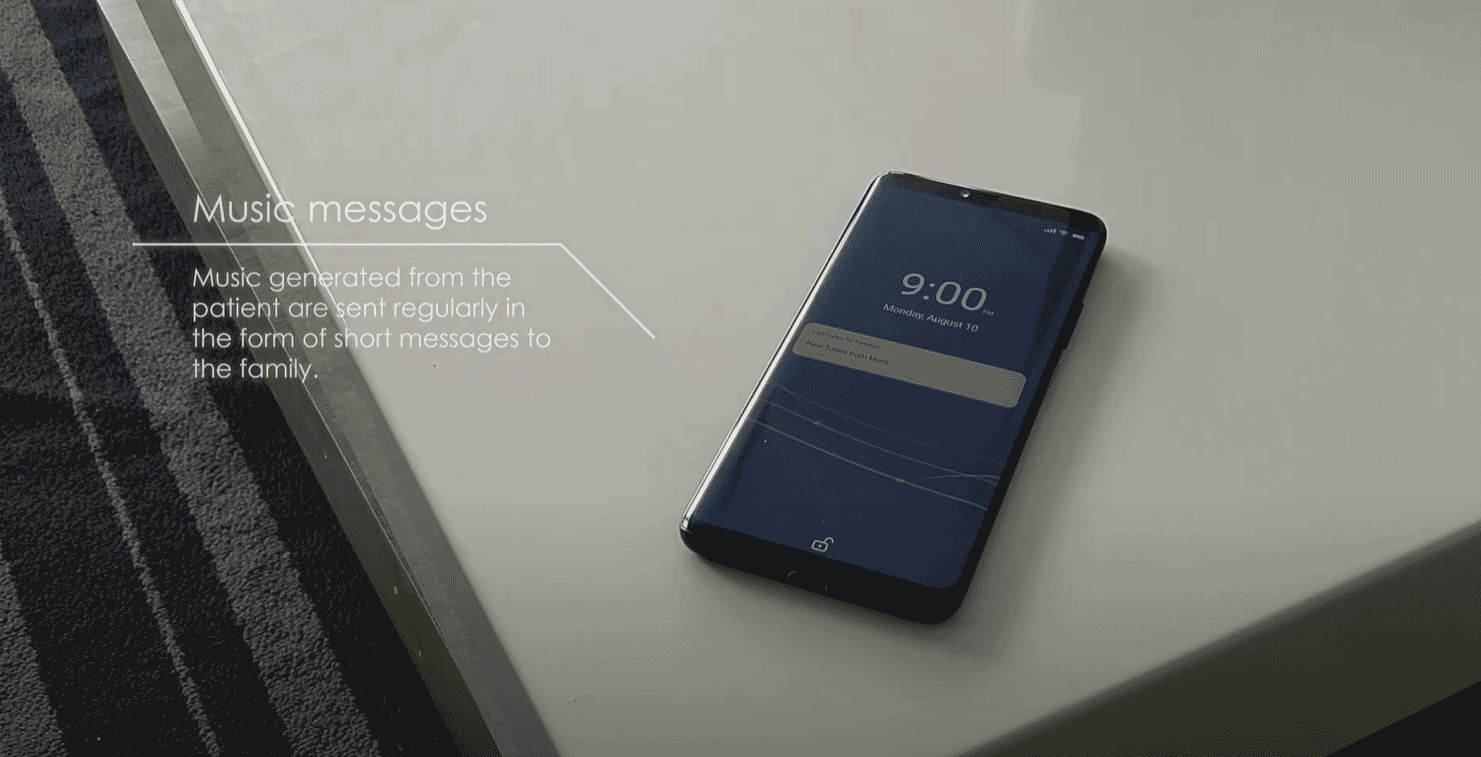
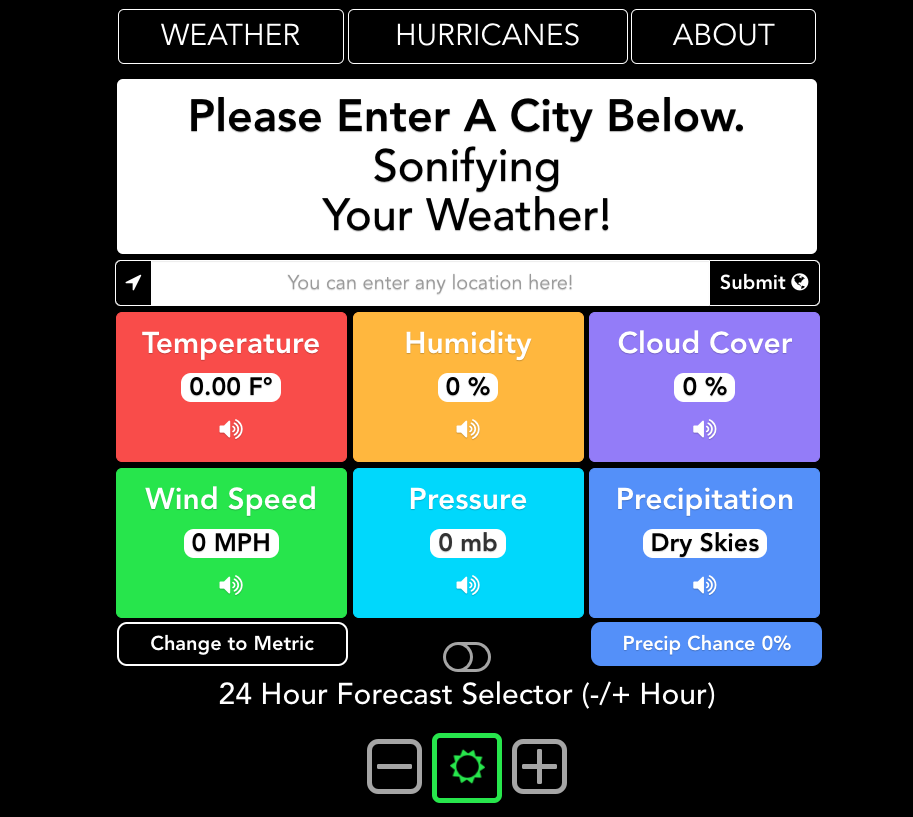
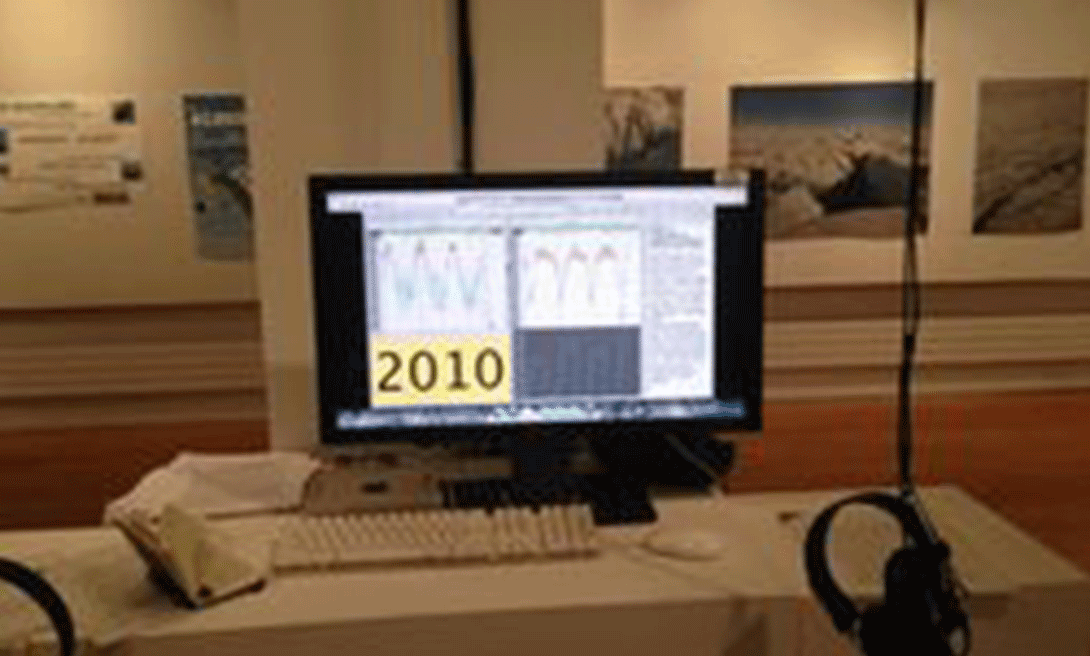
RainMind is designed as a web-based application that transforms the physiological data into a dynamic natural soundscape, supporting self-reflection throughout a day. We used the Heart Rate Variability (HRV), Electrical Skin Activity (EDA), and Heart Rate (HR) to represent a user’s temporal stress level changes. The sounds of rain, thunder, and bird song, which are commonly found in the rainy-day soundscape, were chosen to represent variations in the three physiological measures.
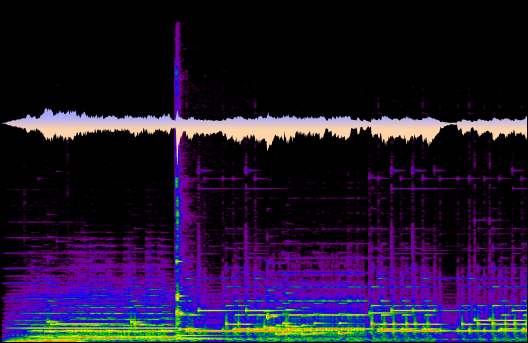
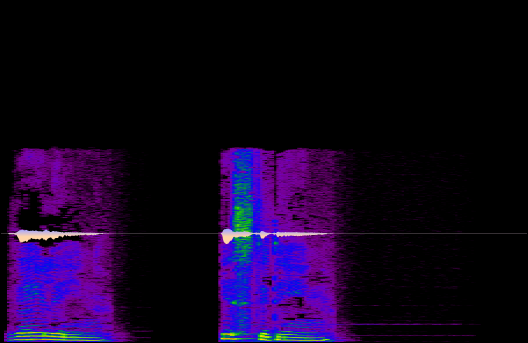
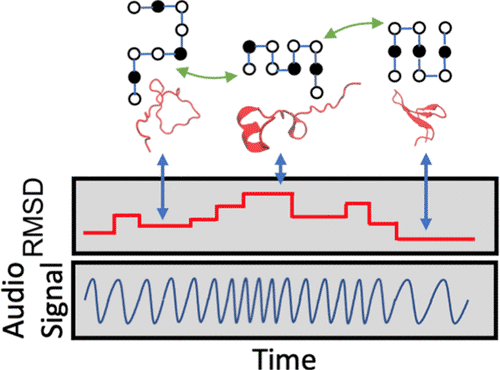
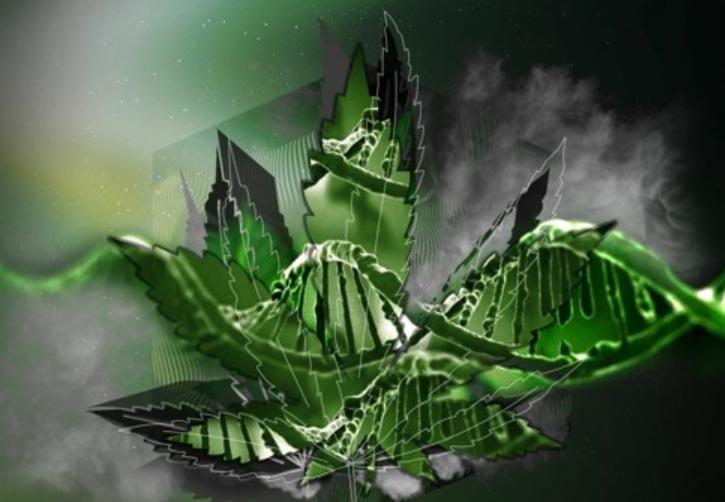
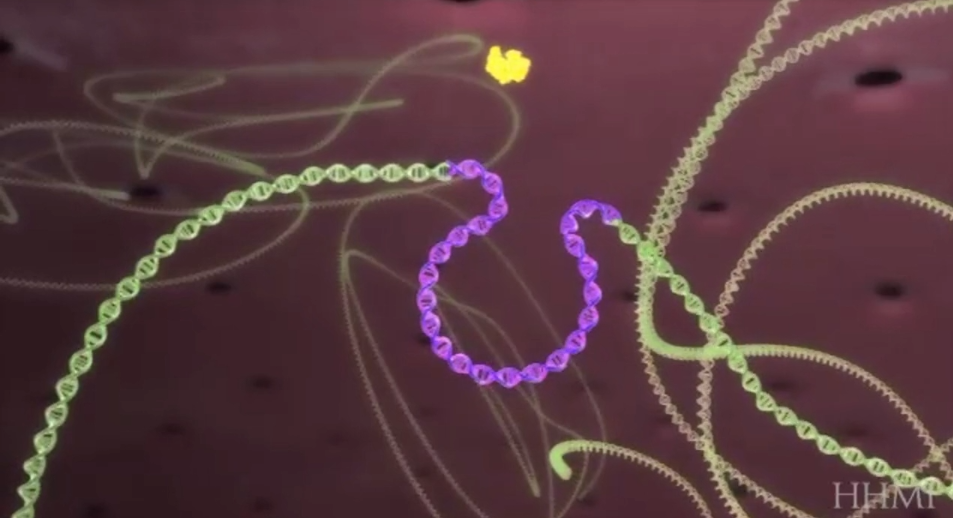
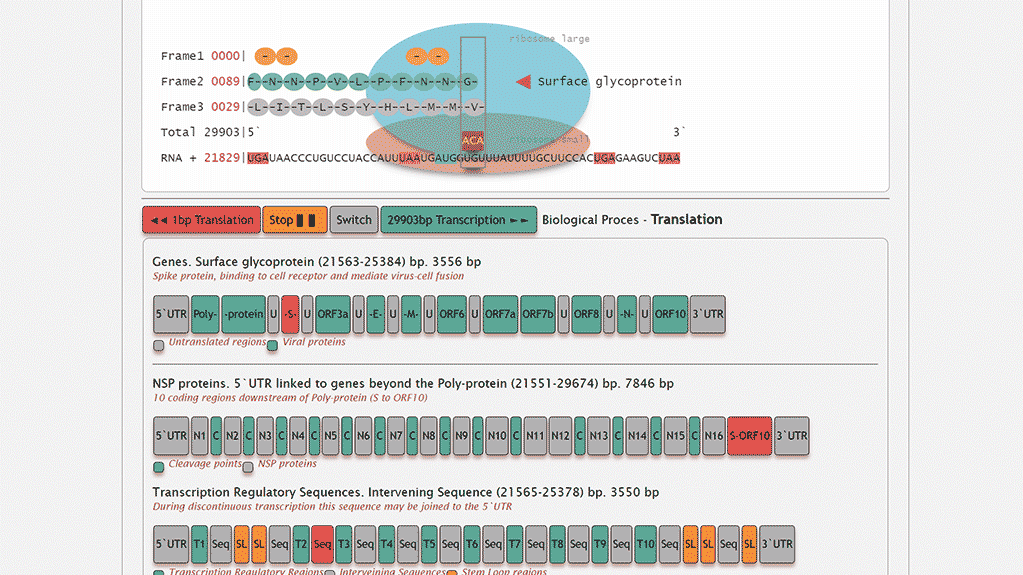
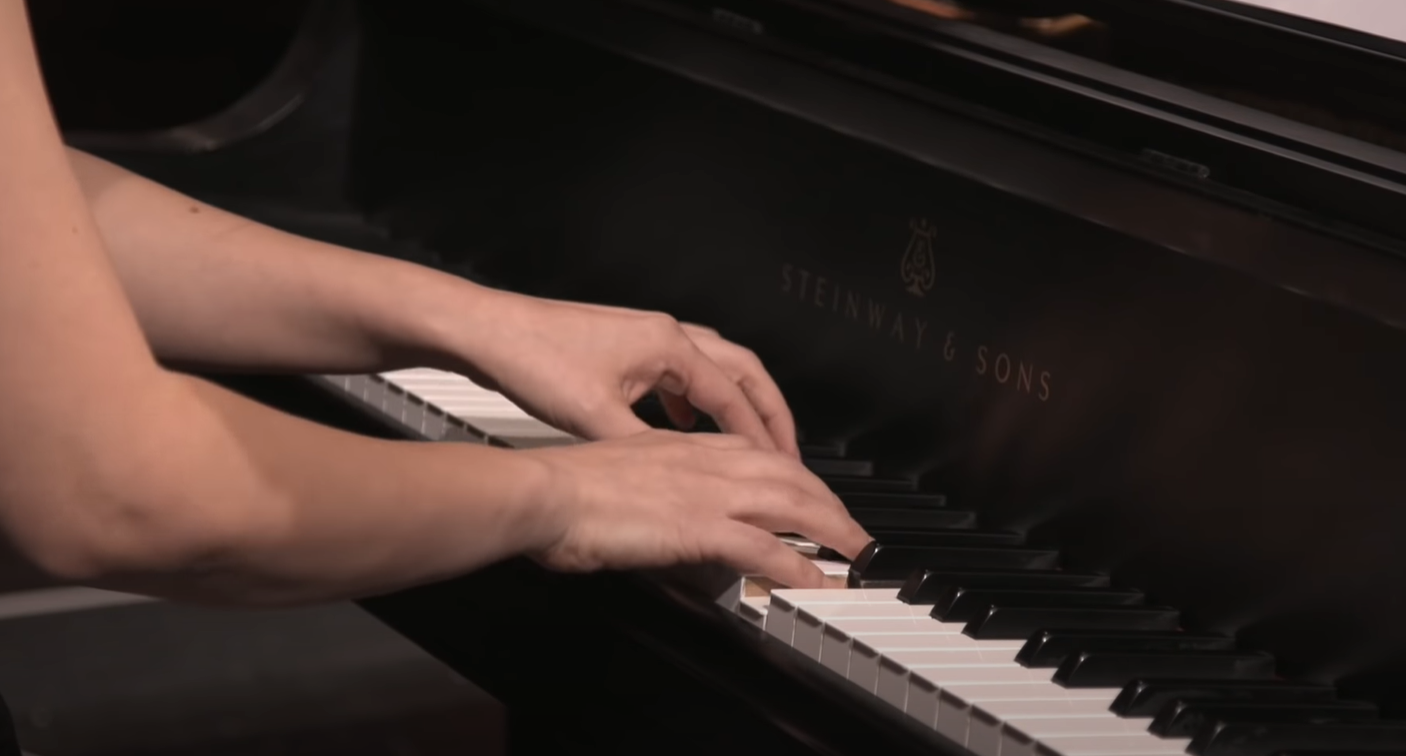
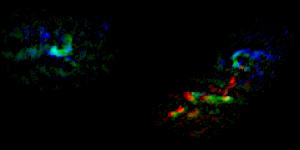
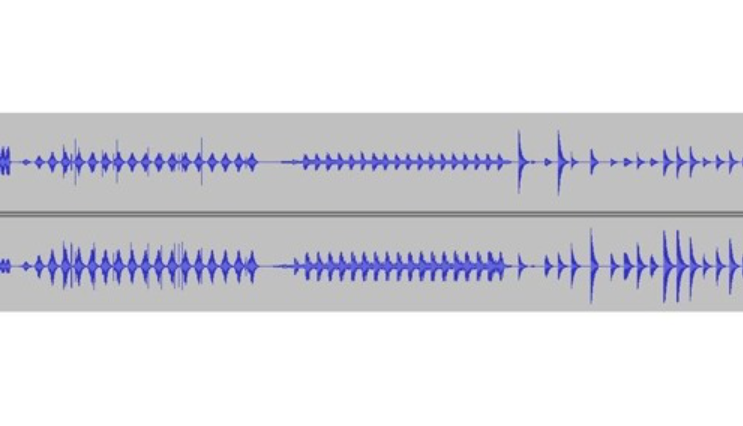
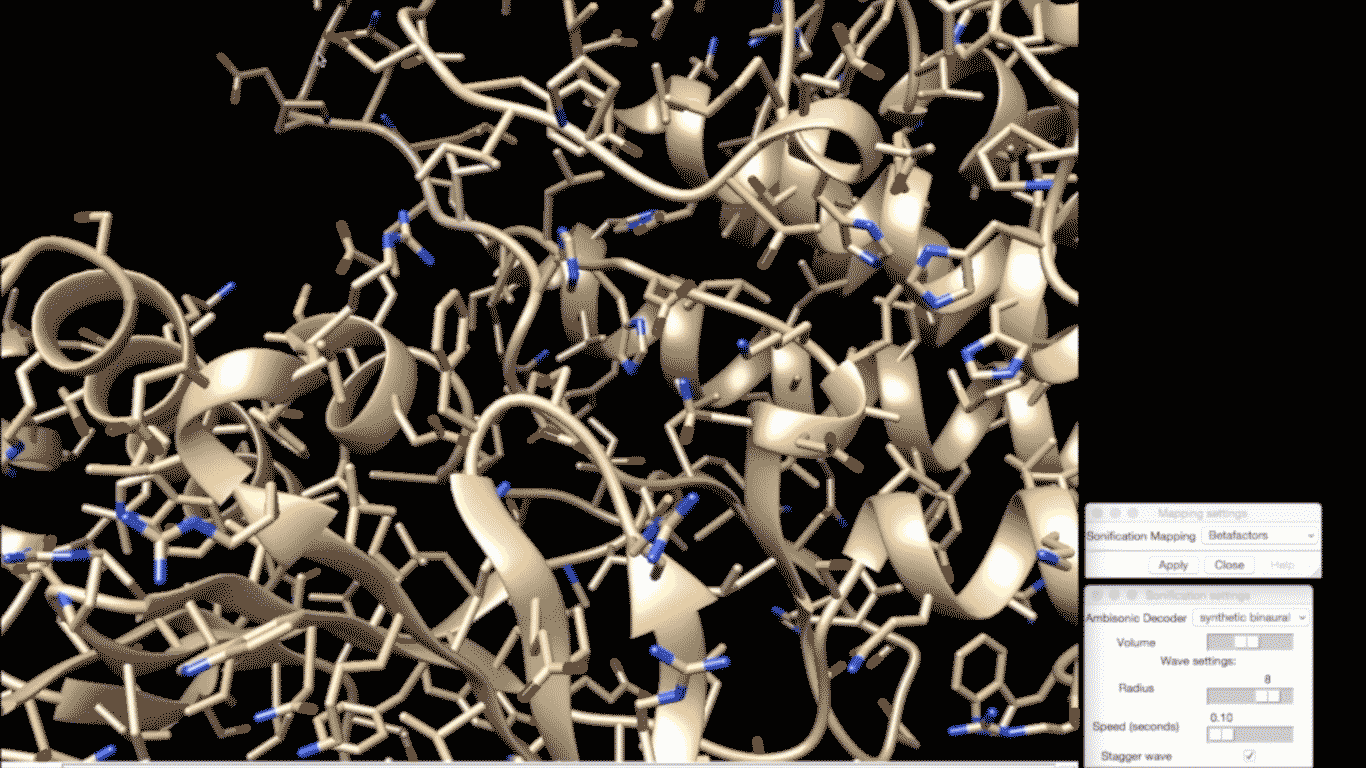
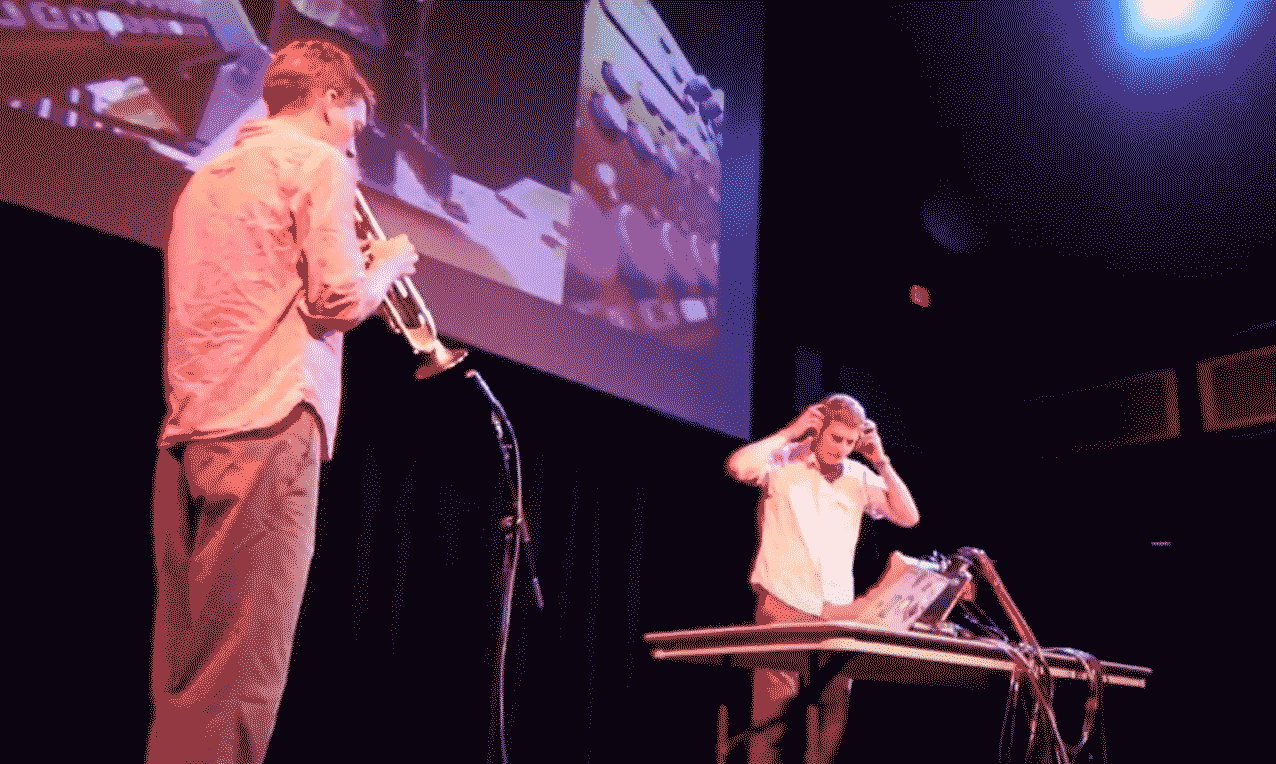
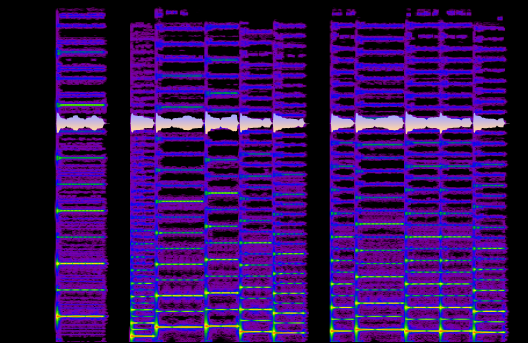
Sonification of the primary structure of human protein Myozin III. Myozin III is responsible for development of stereocilia – the hairs of the hearing cells in our cochlea. Mutations in the myosin-III coding gene cause the protein to mis-develop and lead to hereditary hearing loss.
Following the two protein sequences parallelly – the healthy (L channel) and the mutated (R channel) – we encounter a sonic shift with every amino acid misalignment. Each sonic event (a note) represents an amino acid. The scale was derived from respectable molecular masses and duration of every event from hidrophobicity index. As the piece progresses and the mutation count rises, the correlated sequences get more and more misaligned, leading to an increasingly degraded sense of pitch, rhythm, and amplitude.
It's a comparative sonic analysis aimed to portray how even miniscule genetic misalignments result in a radical cascading change of perceptive and functional meaning in the genetic code - amino acid sequence.
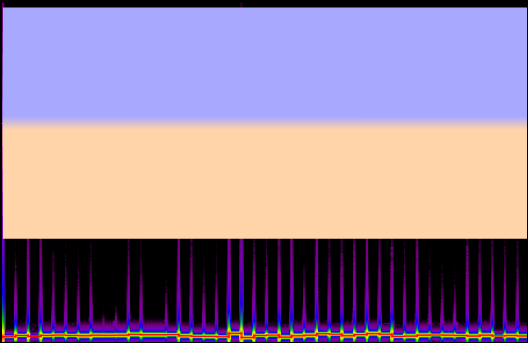
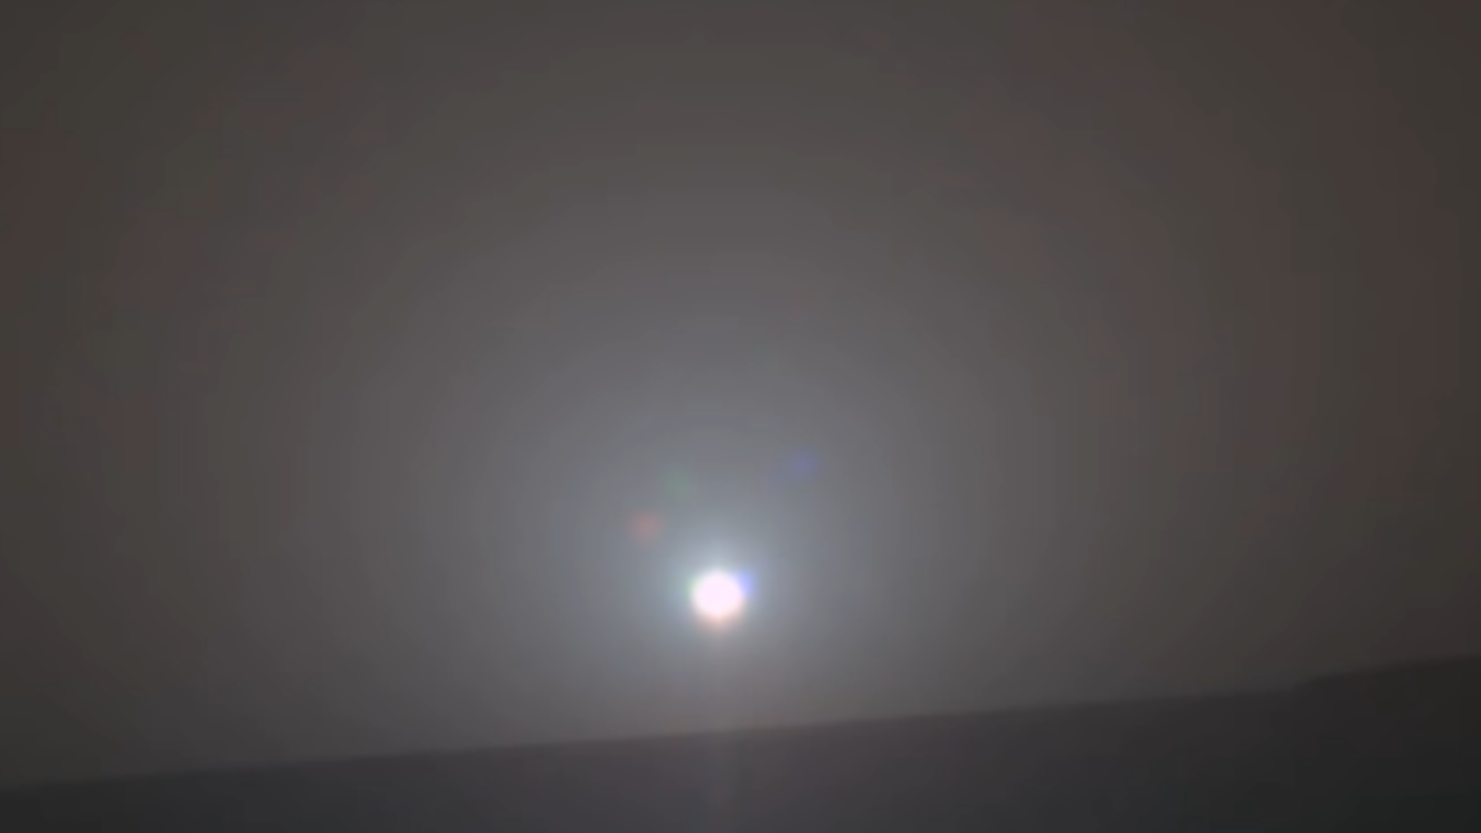
Did you know birds in Germany start singing about one and a half hours before sunrise? If you started your day that early, this is what you would hear: 80 minutes before sunrise in 80 seconds of bird songs.
Our cities aren’t safe for birds: Each and every year, millions of them lose their lives due to window collisions. However, these deaths usually remain more or less unseen. Some projects document the problem, for example the Global Bird Collision Mapper. For this sonification, we used their data to show what one hour of birds dying in Toronto could sound like in a minute.
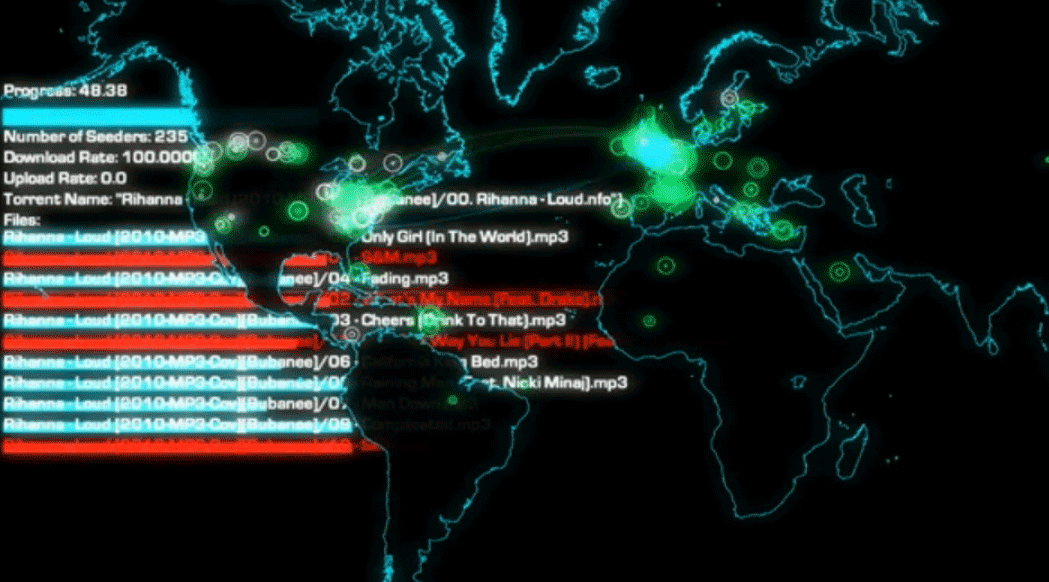
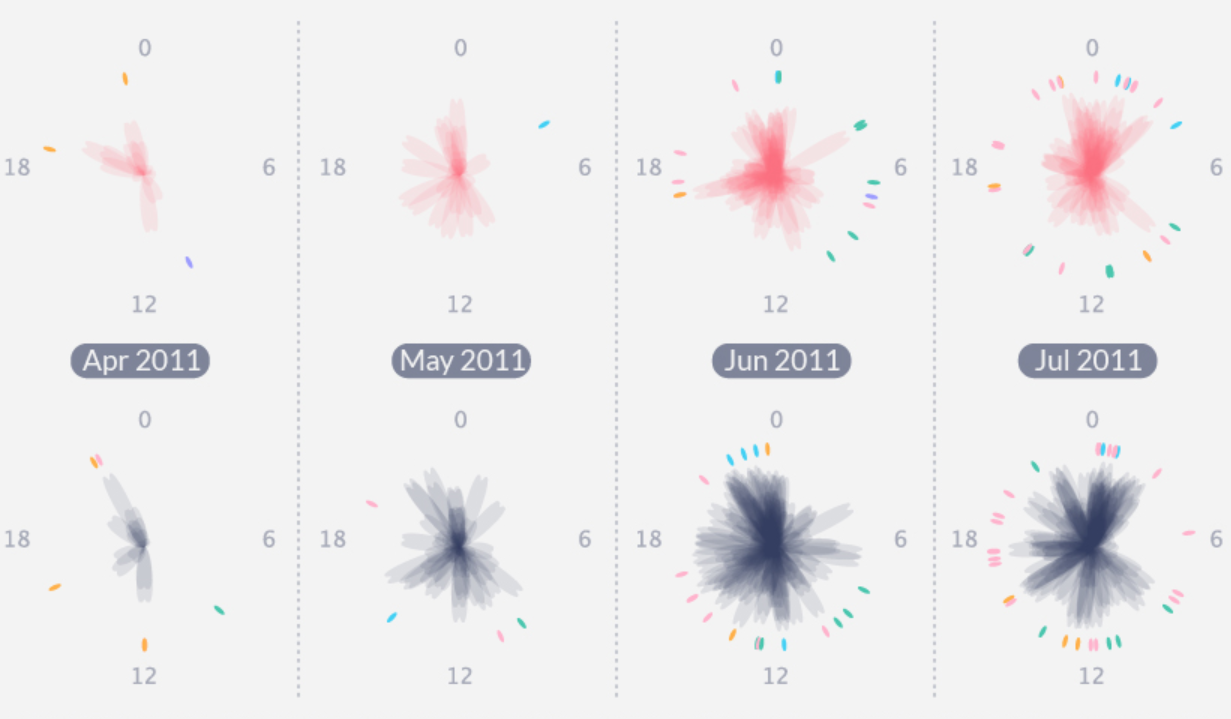
Behind our intentional clicks and taps in browsers lies a hidden world: The world of first- and third-party requests. 🦥🕸🌳 When we browse our way through the digital jungle of information, we leave footprints 👣 By opening a website or searching for something on Google, we tell the servers what we want to know from them. So, with every click or tap, we send some data.🤳
But almost every click sends our data to dozens of other URLs. Some are necessary to give you what you want. But others, like third-party requests, use your data for advertising and business. In that way, we create an unintentional echo in the virtual world.
For this week’s sonification we tracked our activity in the browser for one month to uncover that hidden world:
🔍 In 47 percent of the cases, our data got sent to 10 or less URLs
🔍 In 16 percent of the cases between 10 and 20 URLs.
🔍But in 10 percent of the cases, our data got even sent to 30-40 different URLs.
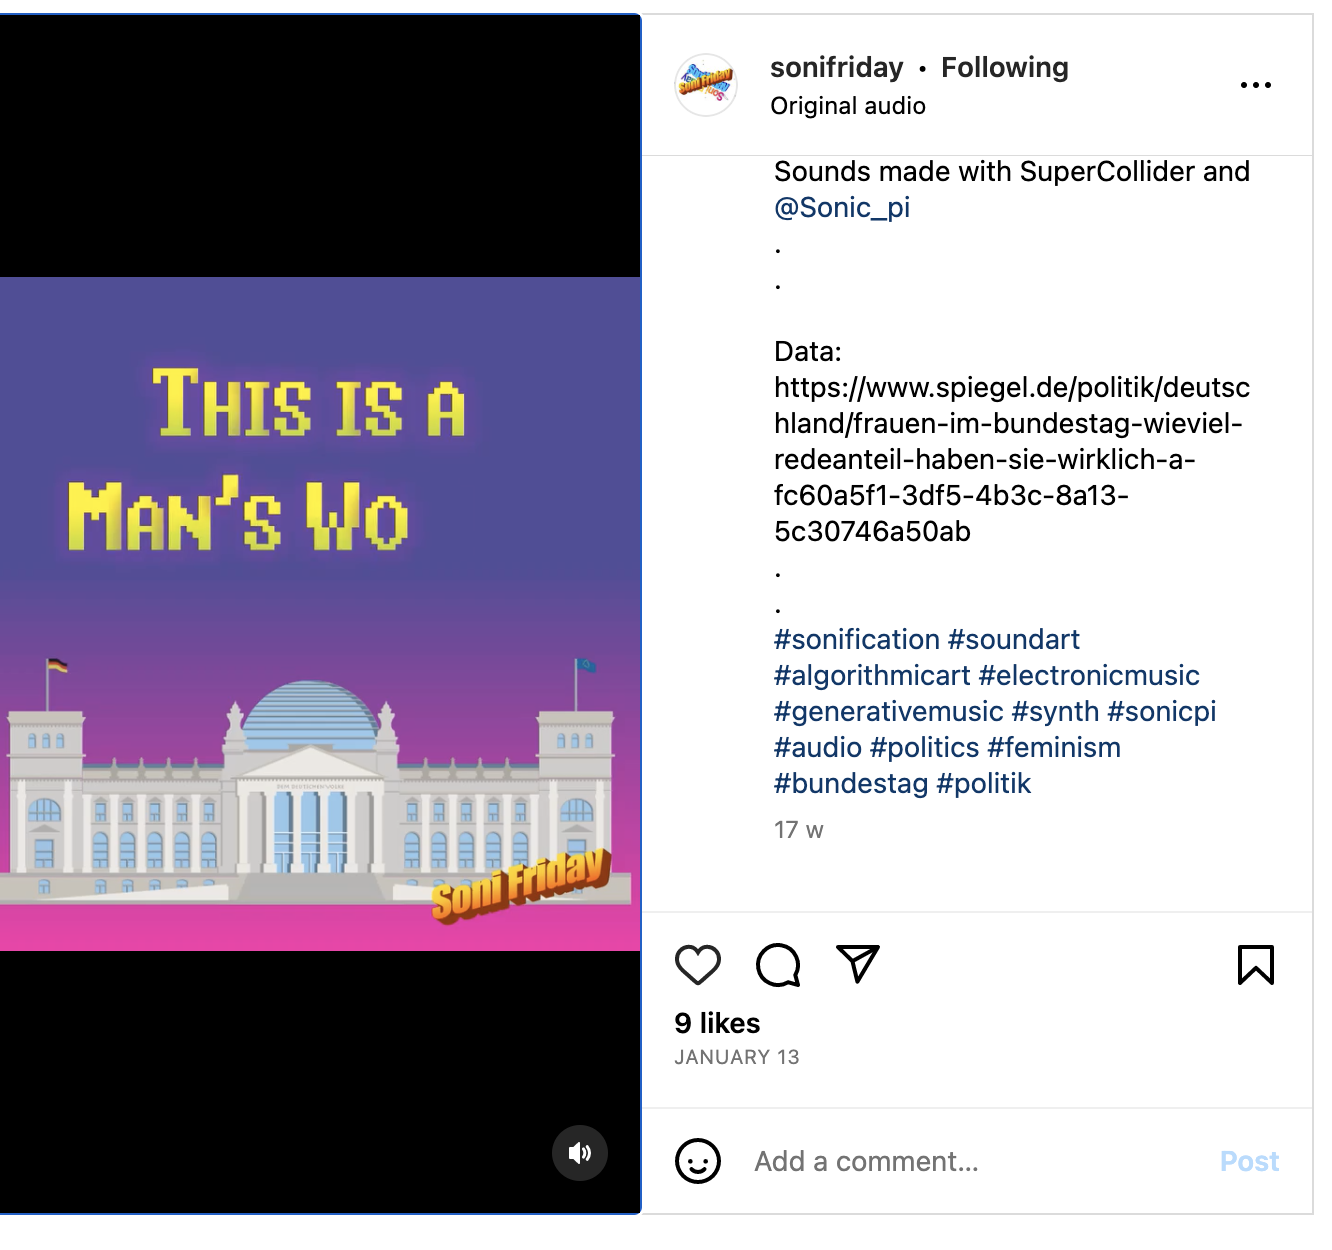
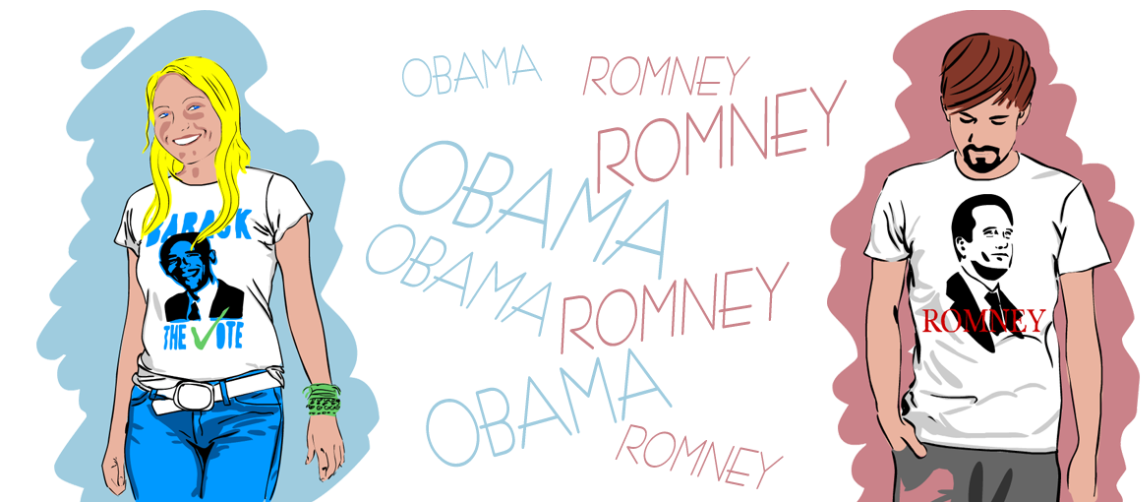
According to a data analysis from “Der Spiegel” (2019), women in the German Bundesteag have had a speaking share of 30 per cent. But it depends in which party they are in. For the sonification, we wanted to know: What would a compressed session of the Bundestag sound like in terms of the distribution of speeches between men and women? Therefore, we recorded more than 30 samples of speeches from all parties and both genders. For the sound, we distributed the samples according to the proportion of speeches - men in the left headphone, women in the right.
Auditory feedback in tele-rehabilitation based on automated gait classification
Brian Horsak, Michael Iber, Djordje Slijepcevic, Victor Adriel de Jesus Oliveira, Tarique Siragy, Bernhard Dumphart, Mark Simonlehner, Stefan Ferstl, Joschua Reis, Anna-Maria Raberger, Mario Heller, Kerstin Prock
| 2023
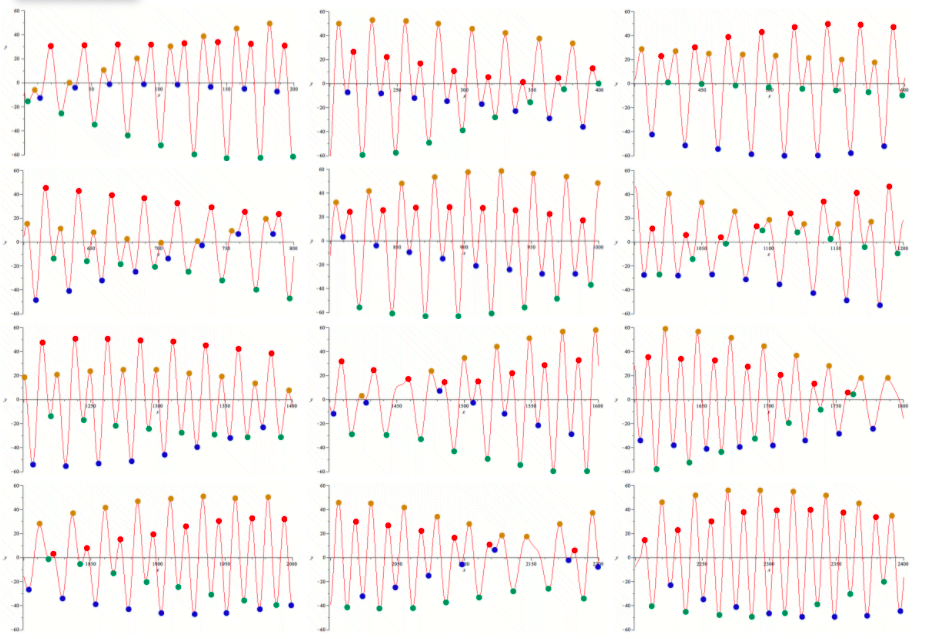
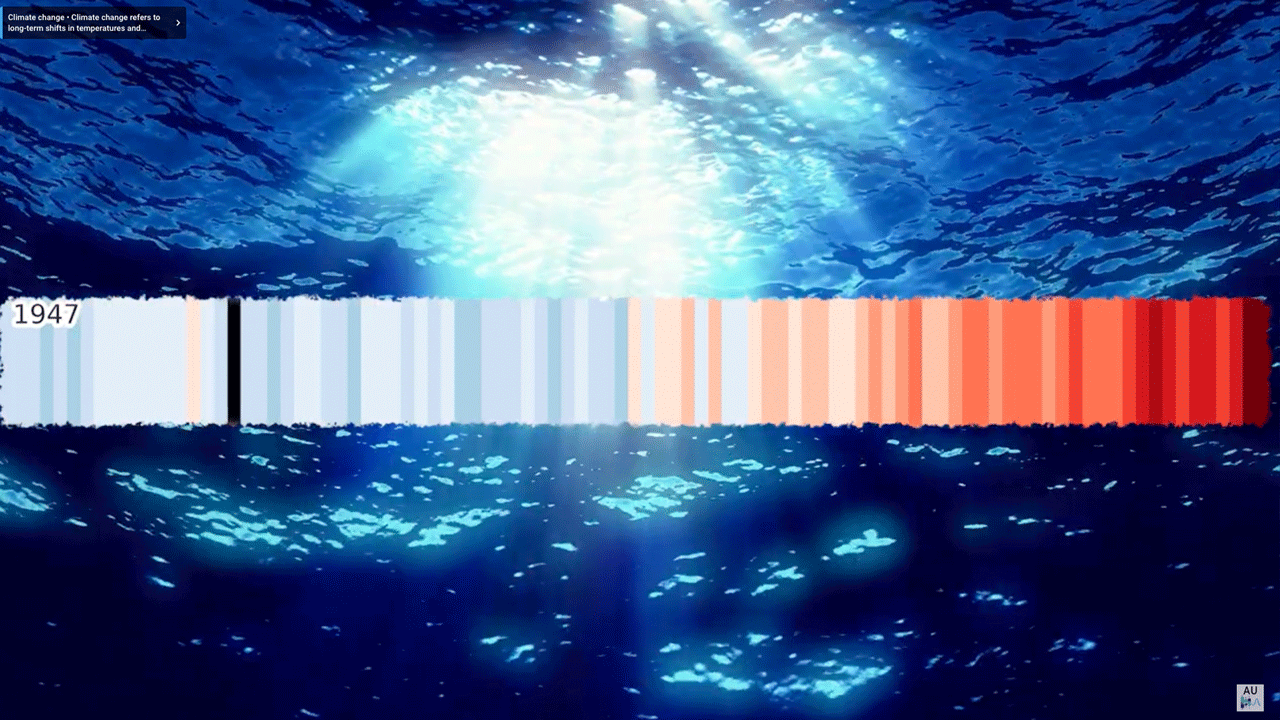
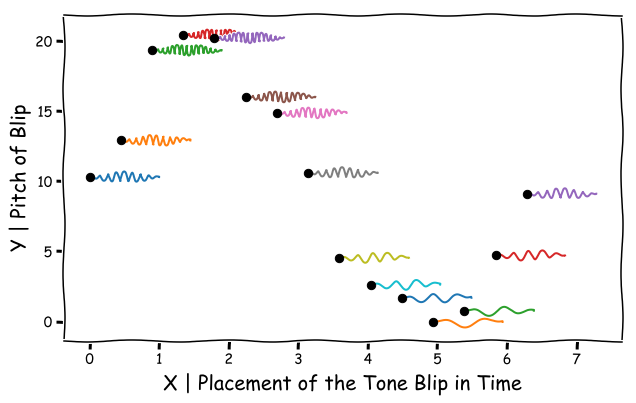
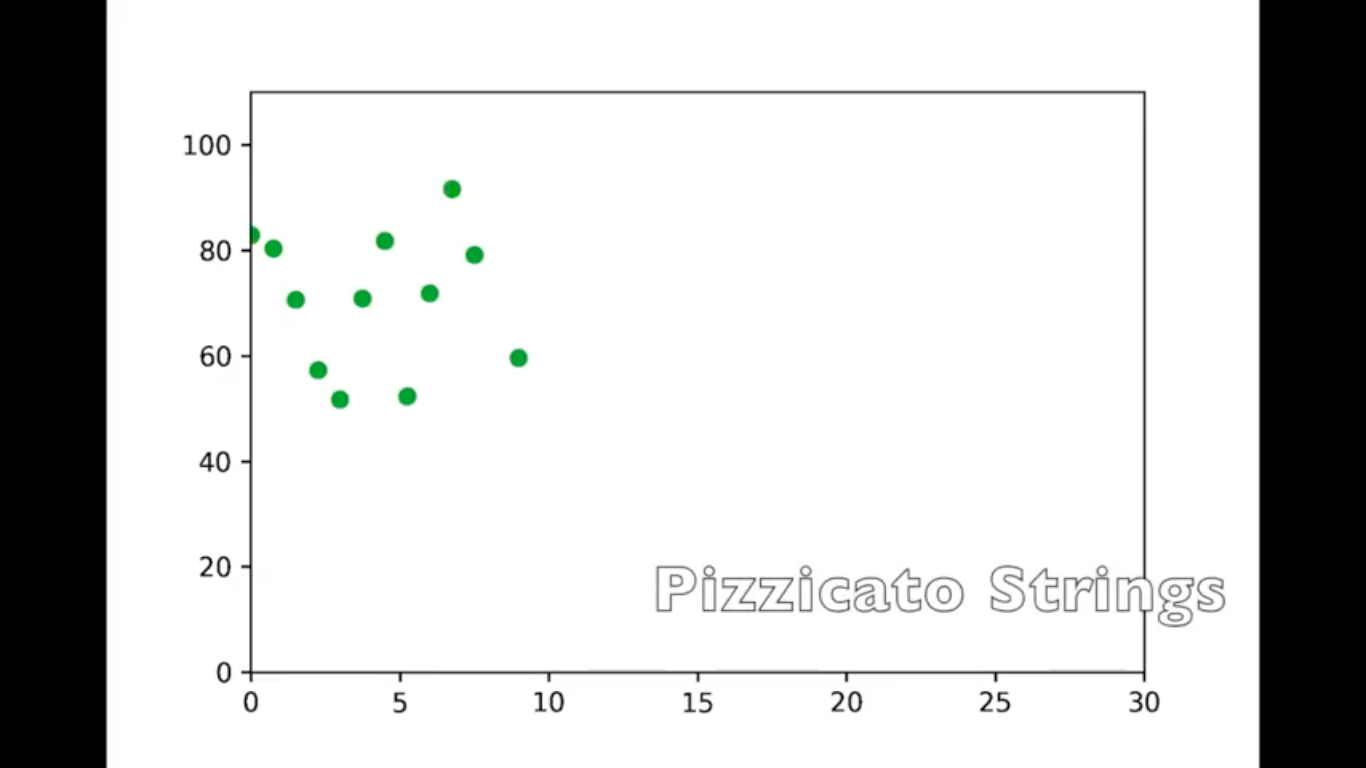
Data sonification based on NOAA sea surface temperature from december 1981 to december 2022, coordinates 42.5W,24.5S
R ccript that assess data to determine key signature, asigns notes, duration and volume upon key signature.
Chords generated within the R script. Script sensitive to the notes on each bar, chords I, IV and V are generated based upon those notes. Animated dot follows temperature, notes and rhythm, changes color depending on sea surface temperature. Key signature, chords and bars displayed on screen
Melody instrument changes to viola when bar with max temperature is played, changes to pizzicato when bar with min temperature is played, animated dot size changes on those bars, bigger for max temperature, smaller for min temperature
Color plot line changes to max color when bar with max temperature is played, changes to min color when bar with min temperature is played, chords are played in natural form and first and second inversion based on notes on respective bar, script modified so second inversion is played on root and fifth too
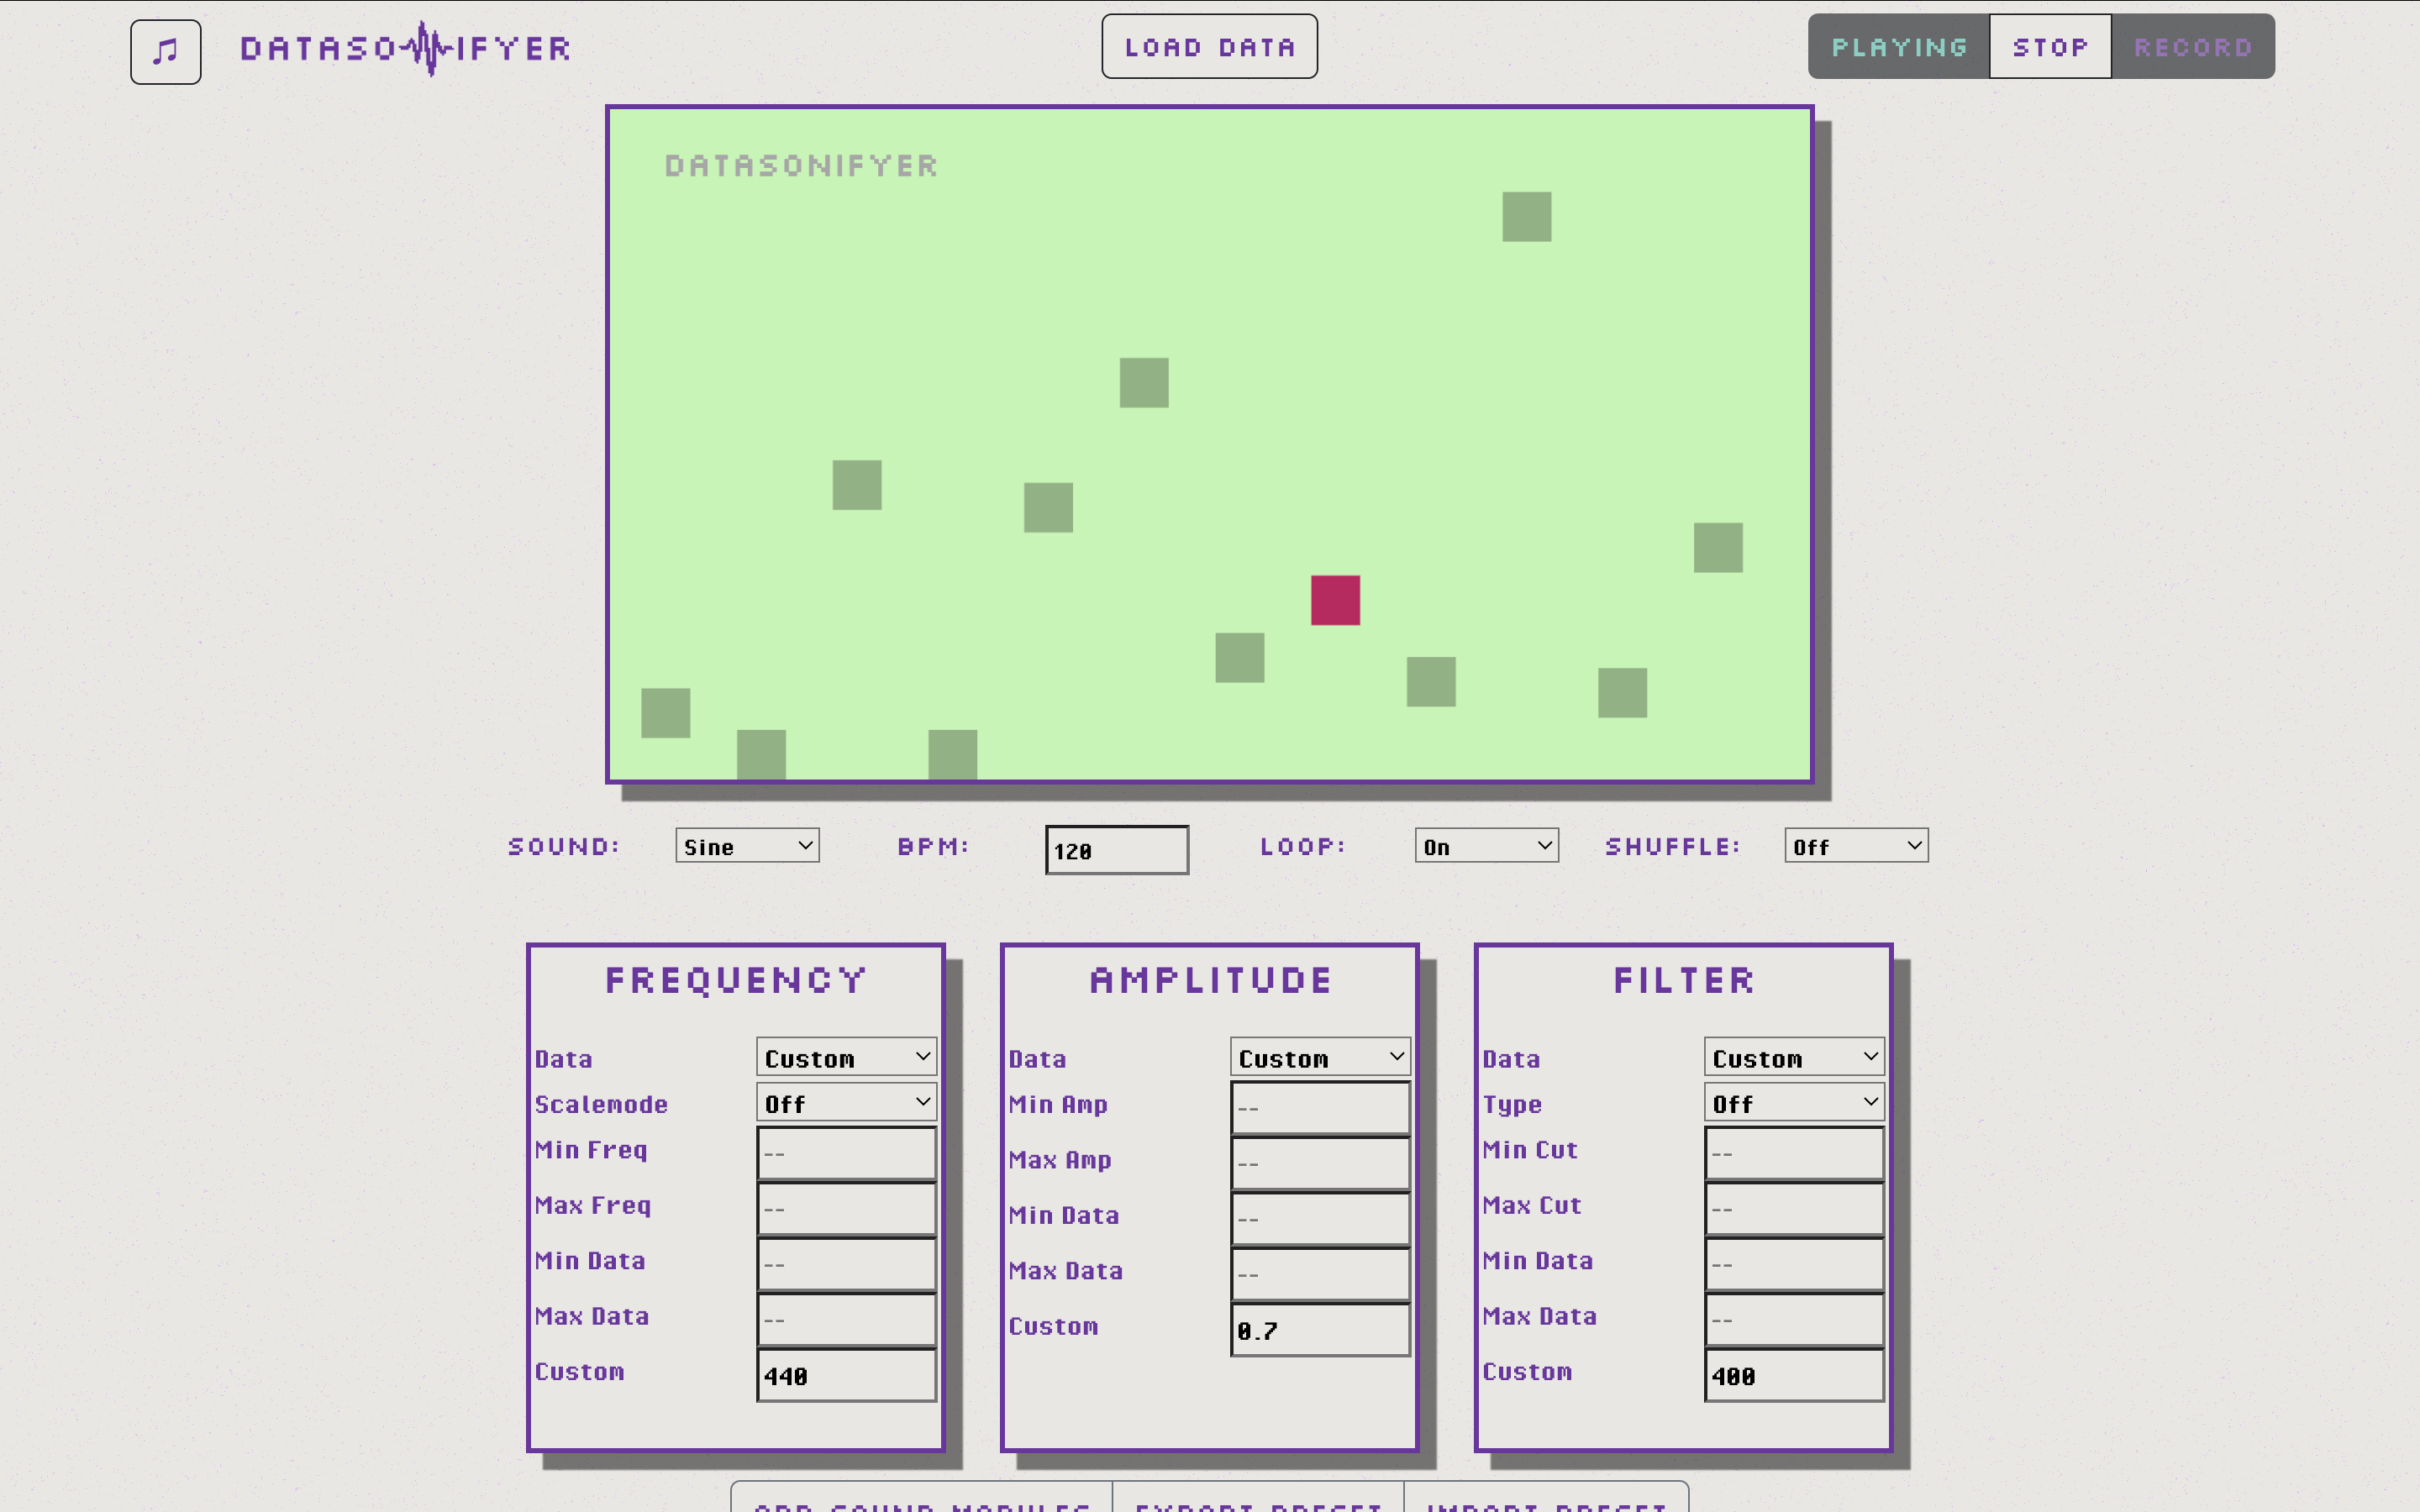
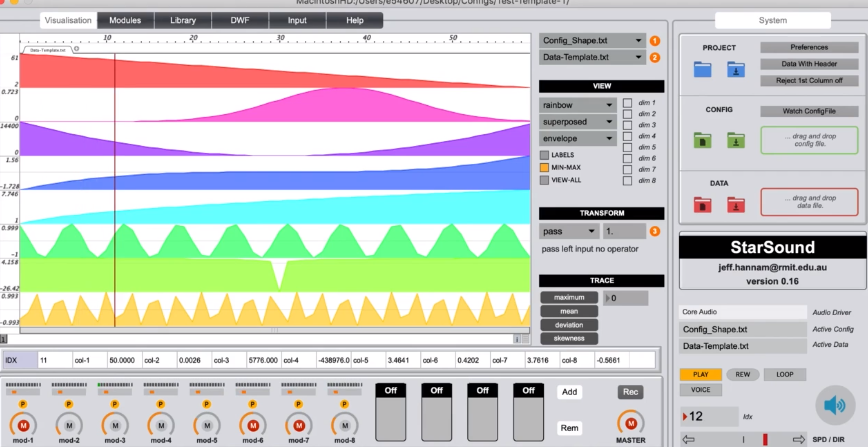
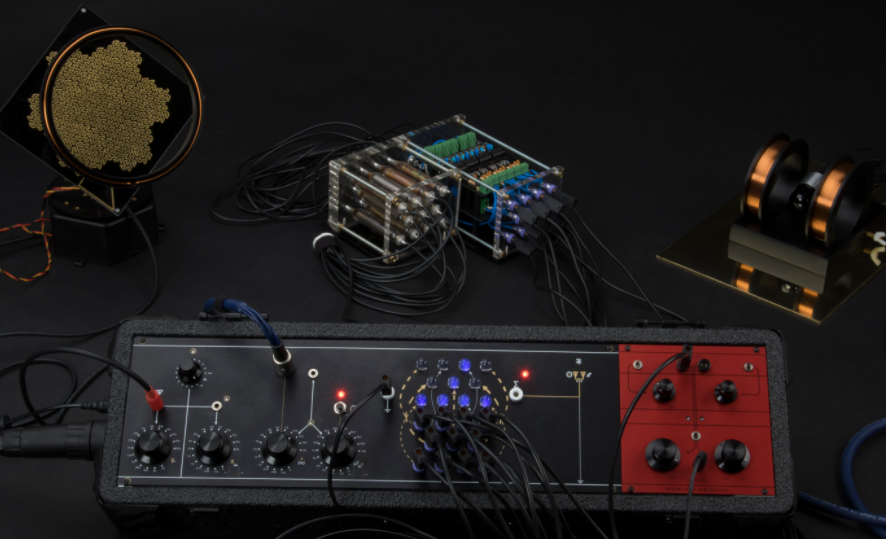
DataSonifyer is a free sonification-tool: It requires no coding skills and gives a lot of opportunities of turning data into sound. DataSonifyer allows you to present your data as pitch, amplitude, envelope, rhythm, cutoff-frequency for filters or as effect. For each of this musical parameters, DataSonifyer has its own module: That means, you can combine multiple datasets for one sonification. DataSonifyer also lets you export and record sonifications for podcasts, radioshow and wherever you want to use sonifications.
DataSonifyer was developed by Christian Basl with a fund of the German Innovationfund by the "Wissenschaftspressekonferenz" in 2023.
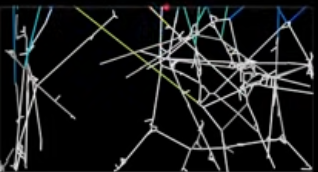
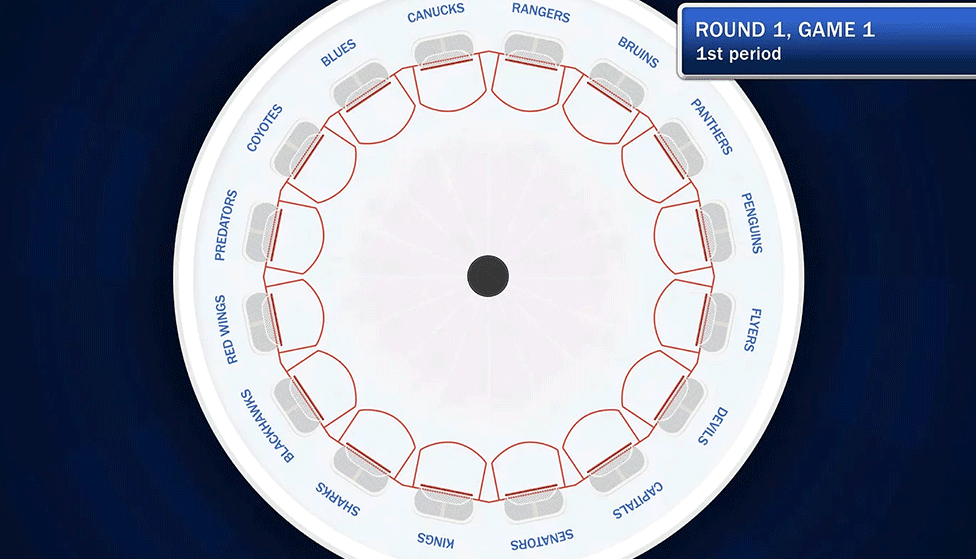
Spiders Song: The Music of Evolution (Phylogenetic Sonification)
Future Ecologies
| 2023
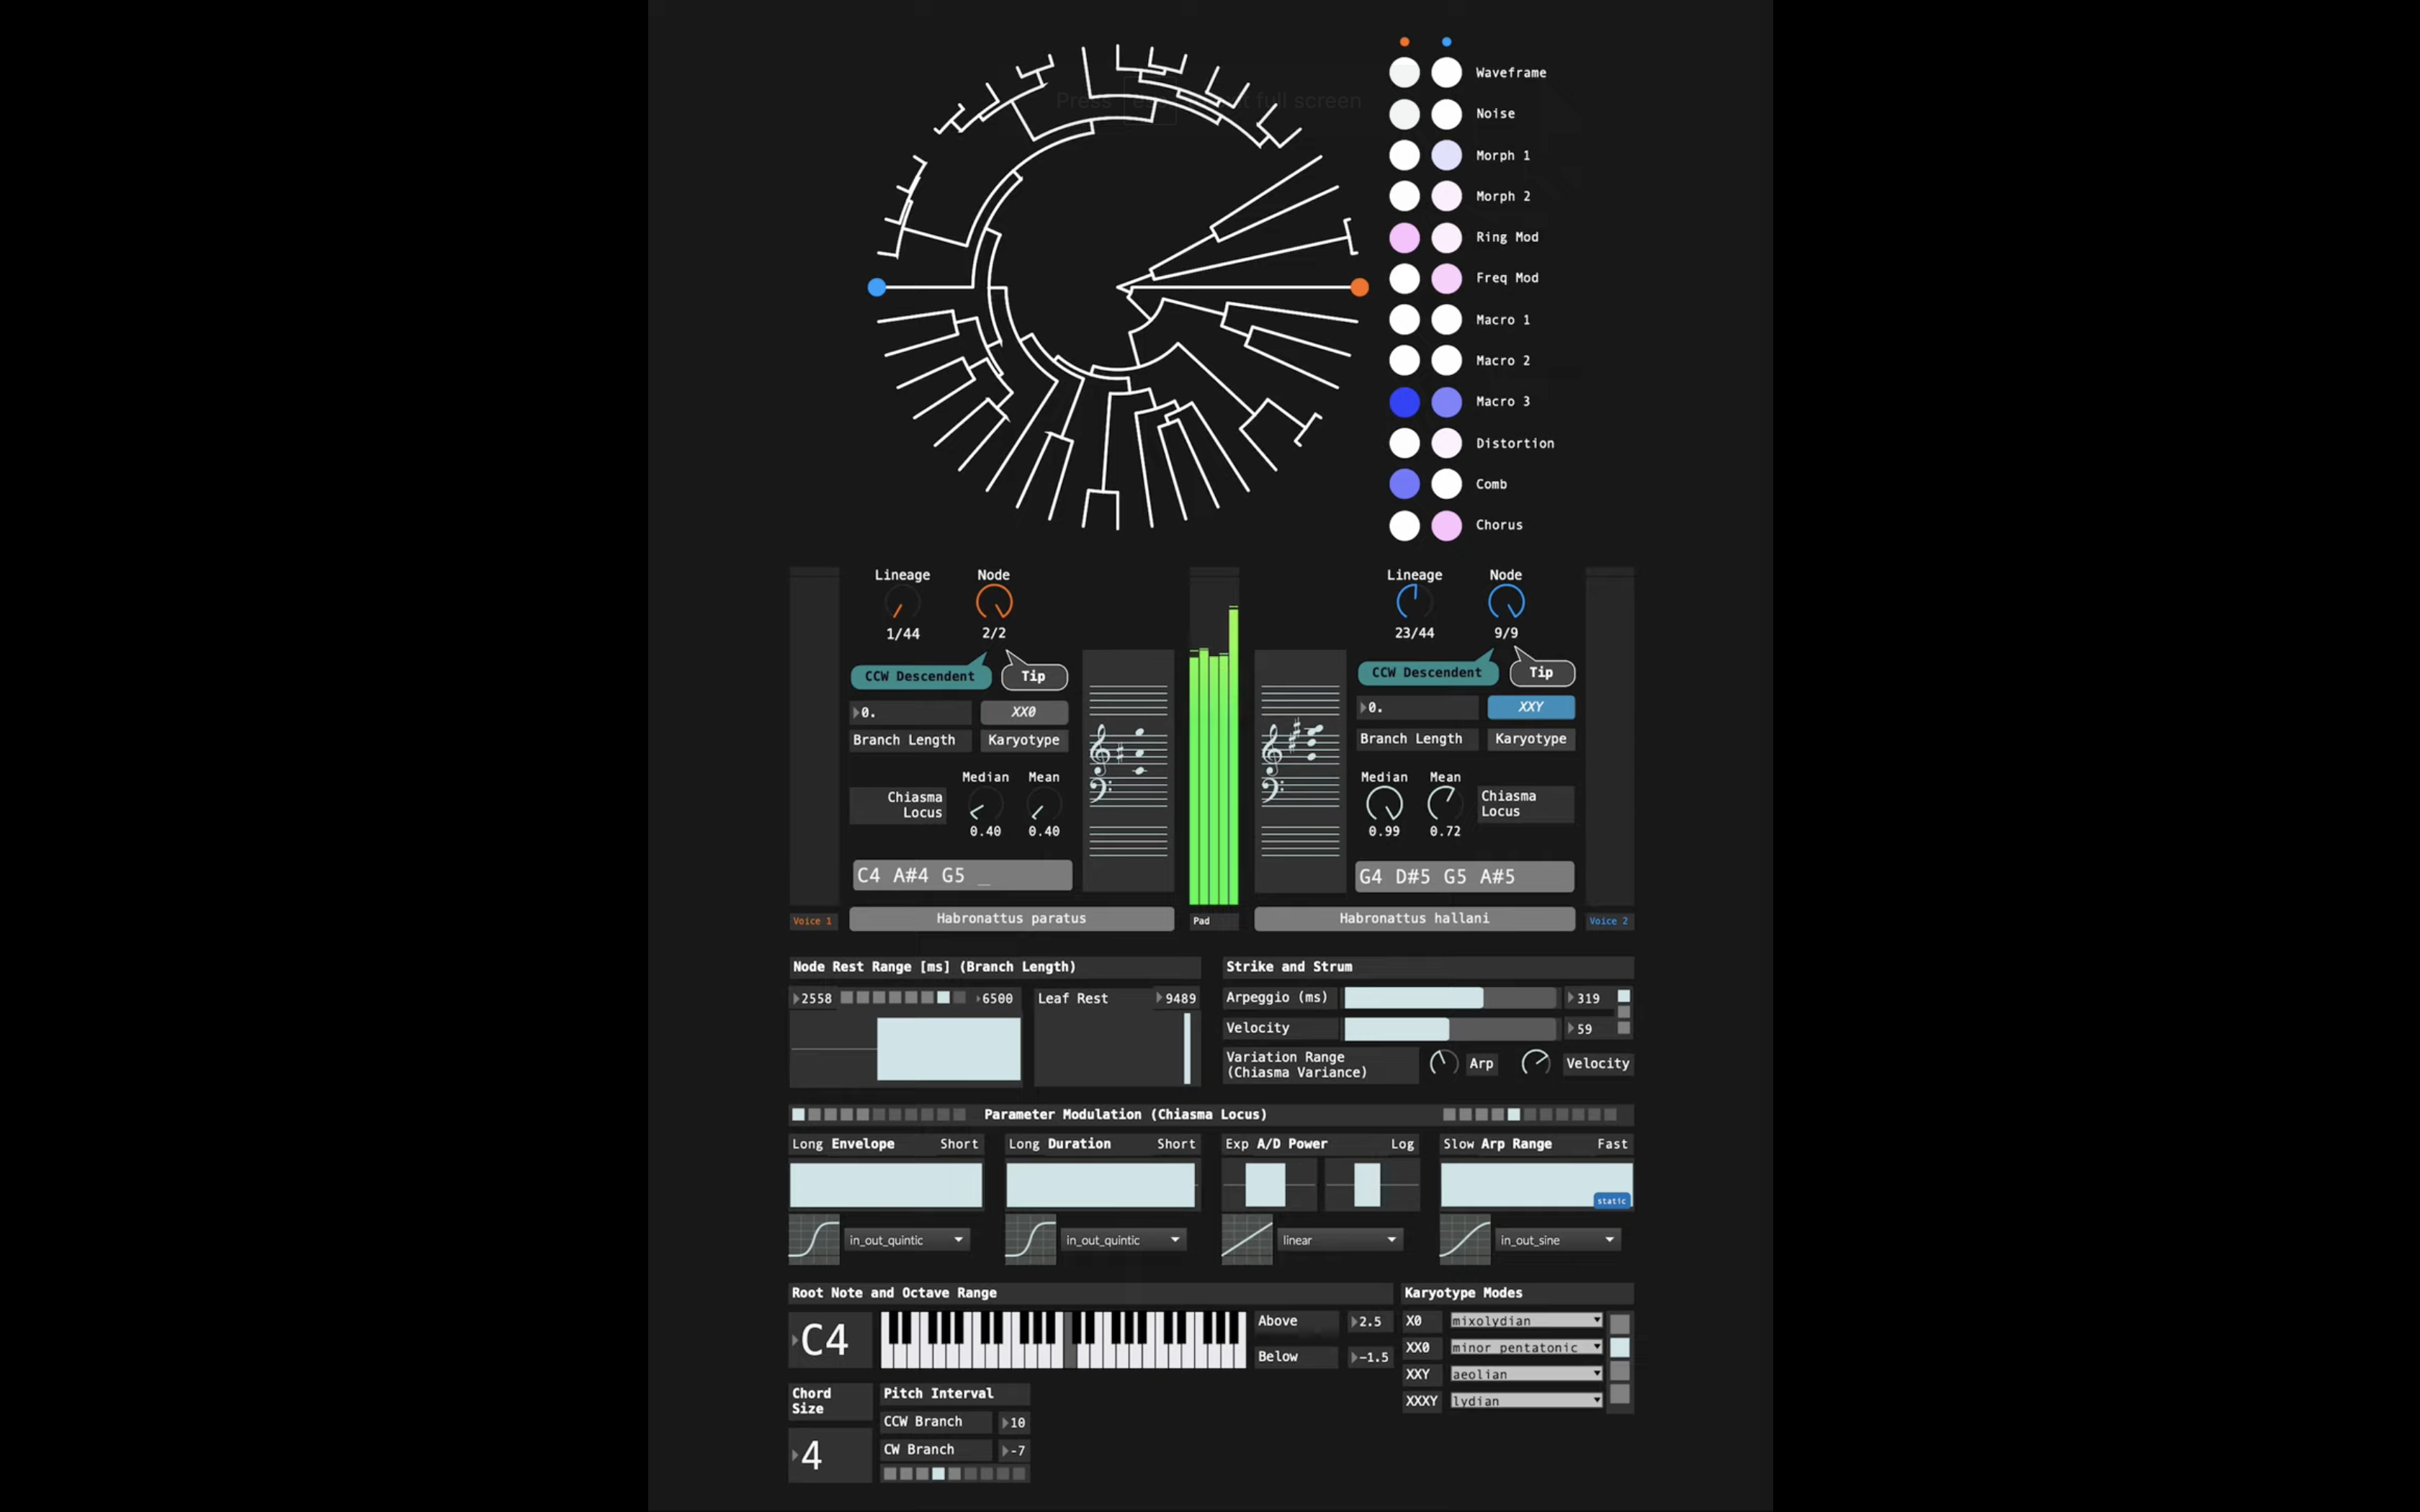
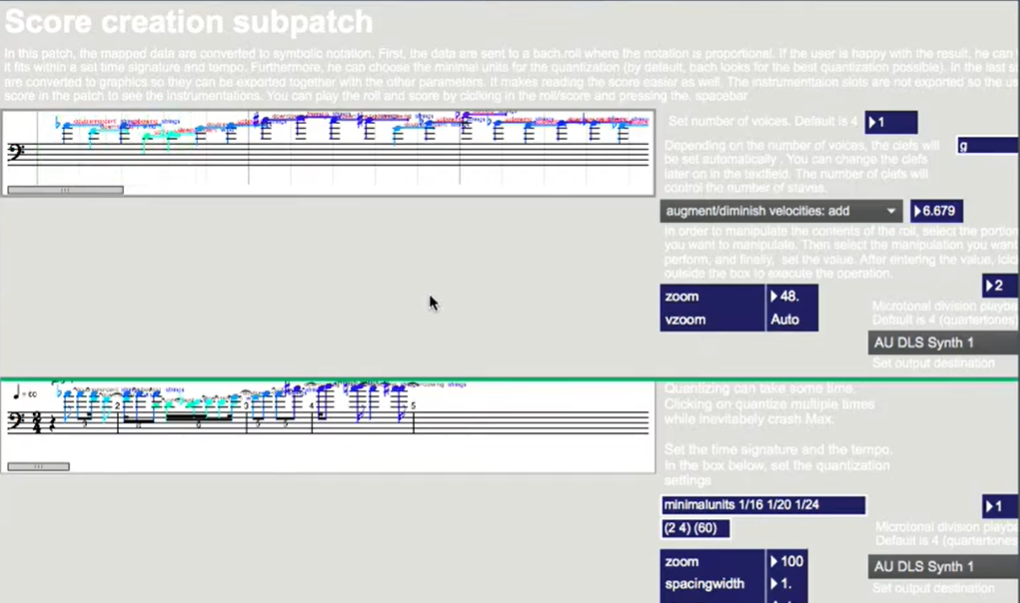
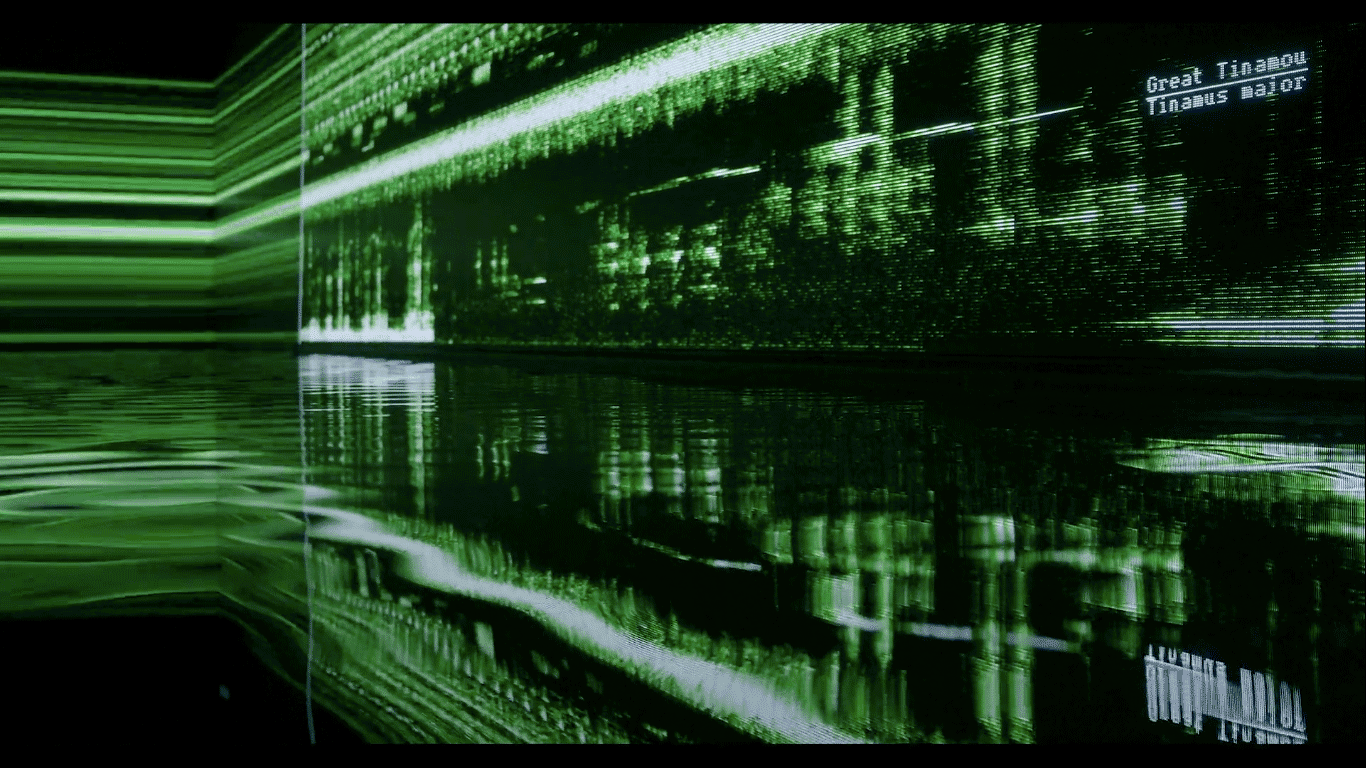
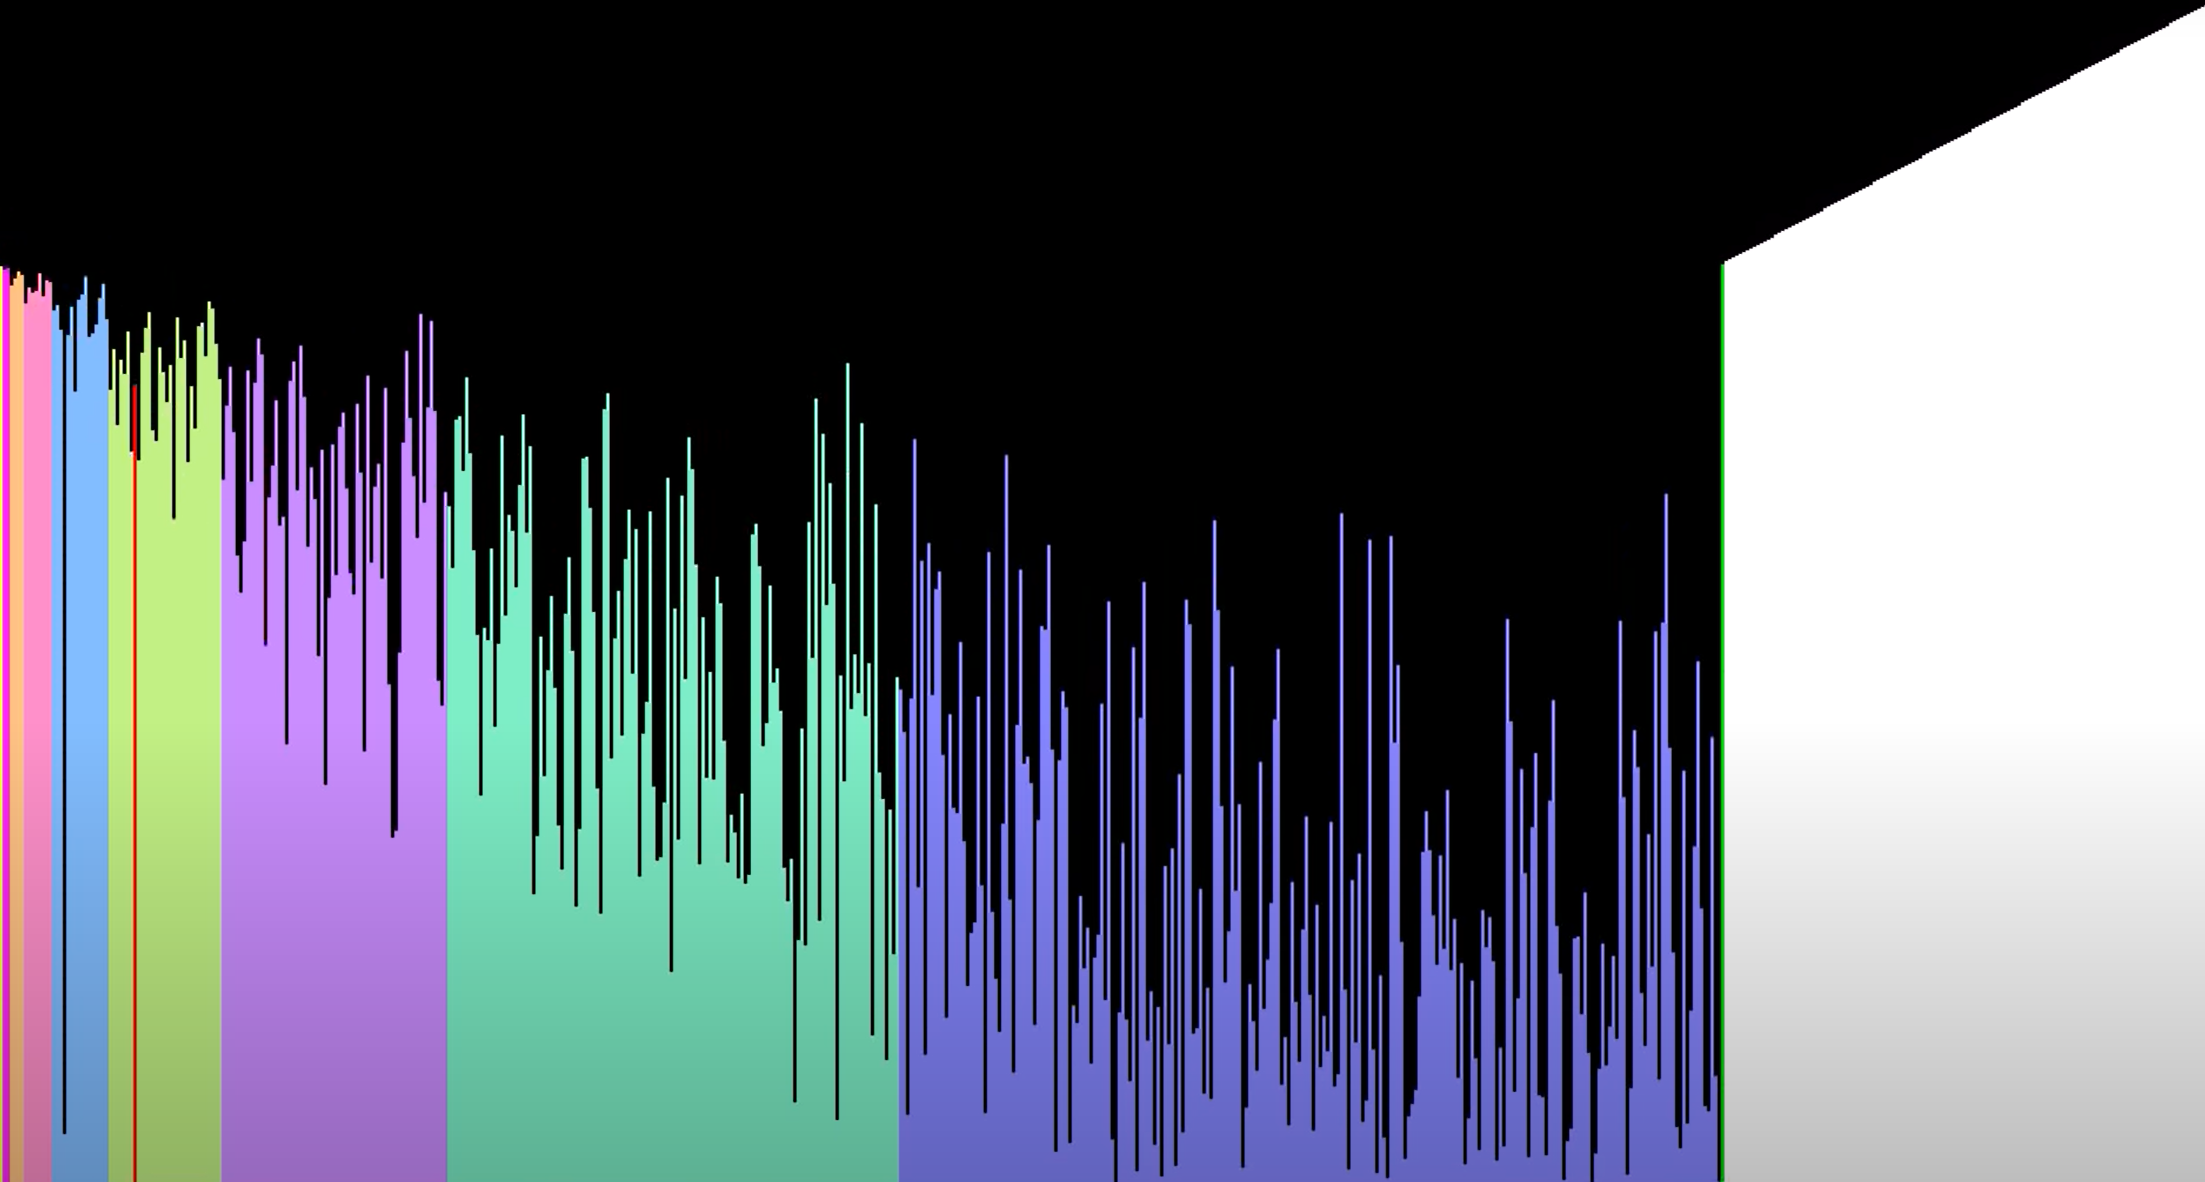
This is a sonification of phylogeny: the evolutionary relationships of a group of organisms. This example has been tailor made to a particular group, the paradise jumping spiders (genus Habronattus), but it is driven by a generative music system that may be adapted for any other tree of life — any group of species, or phylogenetic dataset. It is built in Max/MSP, plus a python script that converts Annotated Newick phylogenetic data into JSON, and released under a GNU-GPLv3 license.
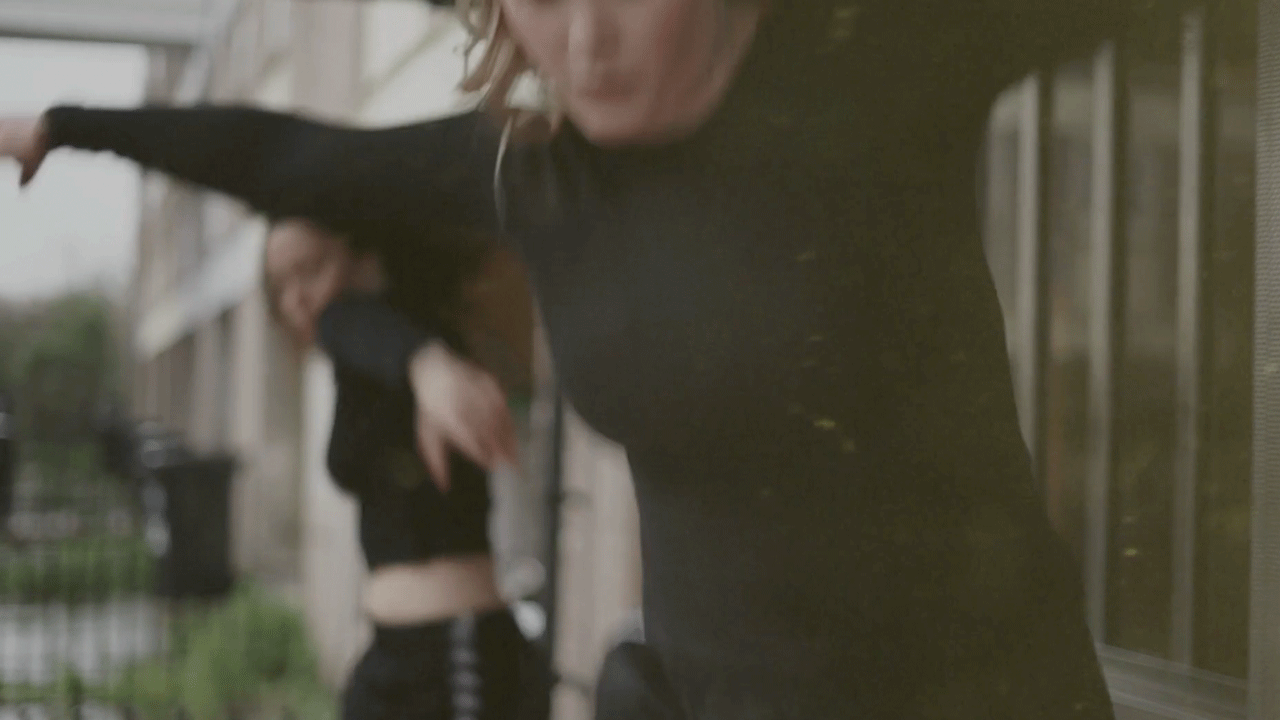
Accompanying this sonification is a 2-part podcast, 96 minutes in total, featuring original music and sound design. Part 1 illustrates evolutionary dynamics as a metaphorical song and dance, exemplified in detail by jumping spiders: an astonishingly diverse group of spiders who literally sing and dance. Part 2 unpacks the practice of data sonification, introduces the newly released sonification system with its musical output, and discusses the role of beauty in science. That can be heard at https://www.futureecologies.net/listen/fe-5-1-spiders-song
The source code and details on the parameter mappings may be found at https://github.com/bowlneudel/spiders-song/ Can you hear the patterns of evolution? Data sonification, the sonic equivalent of data visualization, has found applications in many scientific fields, but never before in phylogenetics: the study of evolutionary relationships. This is the story of many related species expressed as music.
This sonification system is intended as an experimental platform for evolutionary biologists to explore and communicate their data through sound, and for musicians to take inspiration from biodiversity. The patch is open source (GNU-GPLv3)Can you hear the patterns of evolution? Data sonification, the sonic equivalent of data visualization, has found applications in many scientific fields, but never before in phylogenetics: the study of evolutionary relationships. This is the story of many related species expressed as music.
This sonification system is intended as an experimental platform for evolutionary biologists to explore and communicate their data through sound, and for musicians to take inspiration from biodiversity. The patch is open source (GNU-GPLv3)
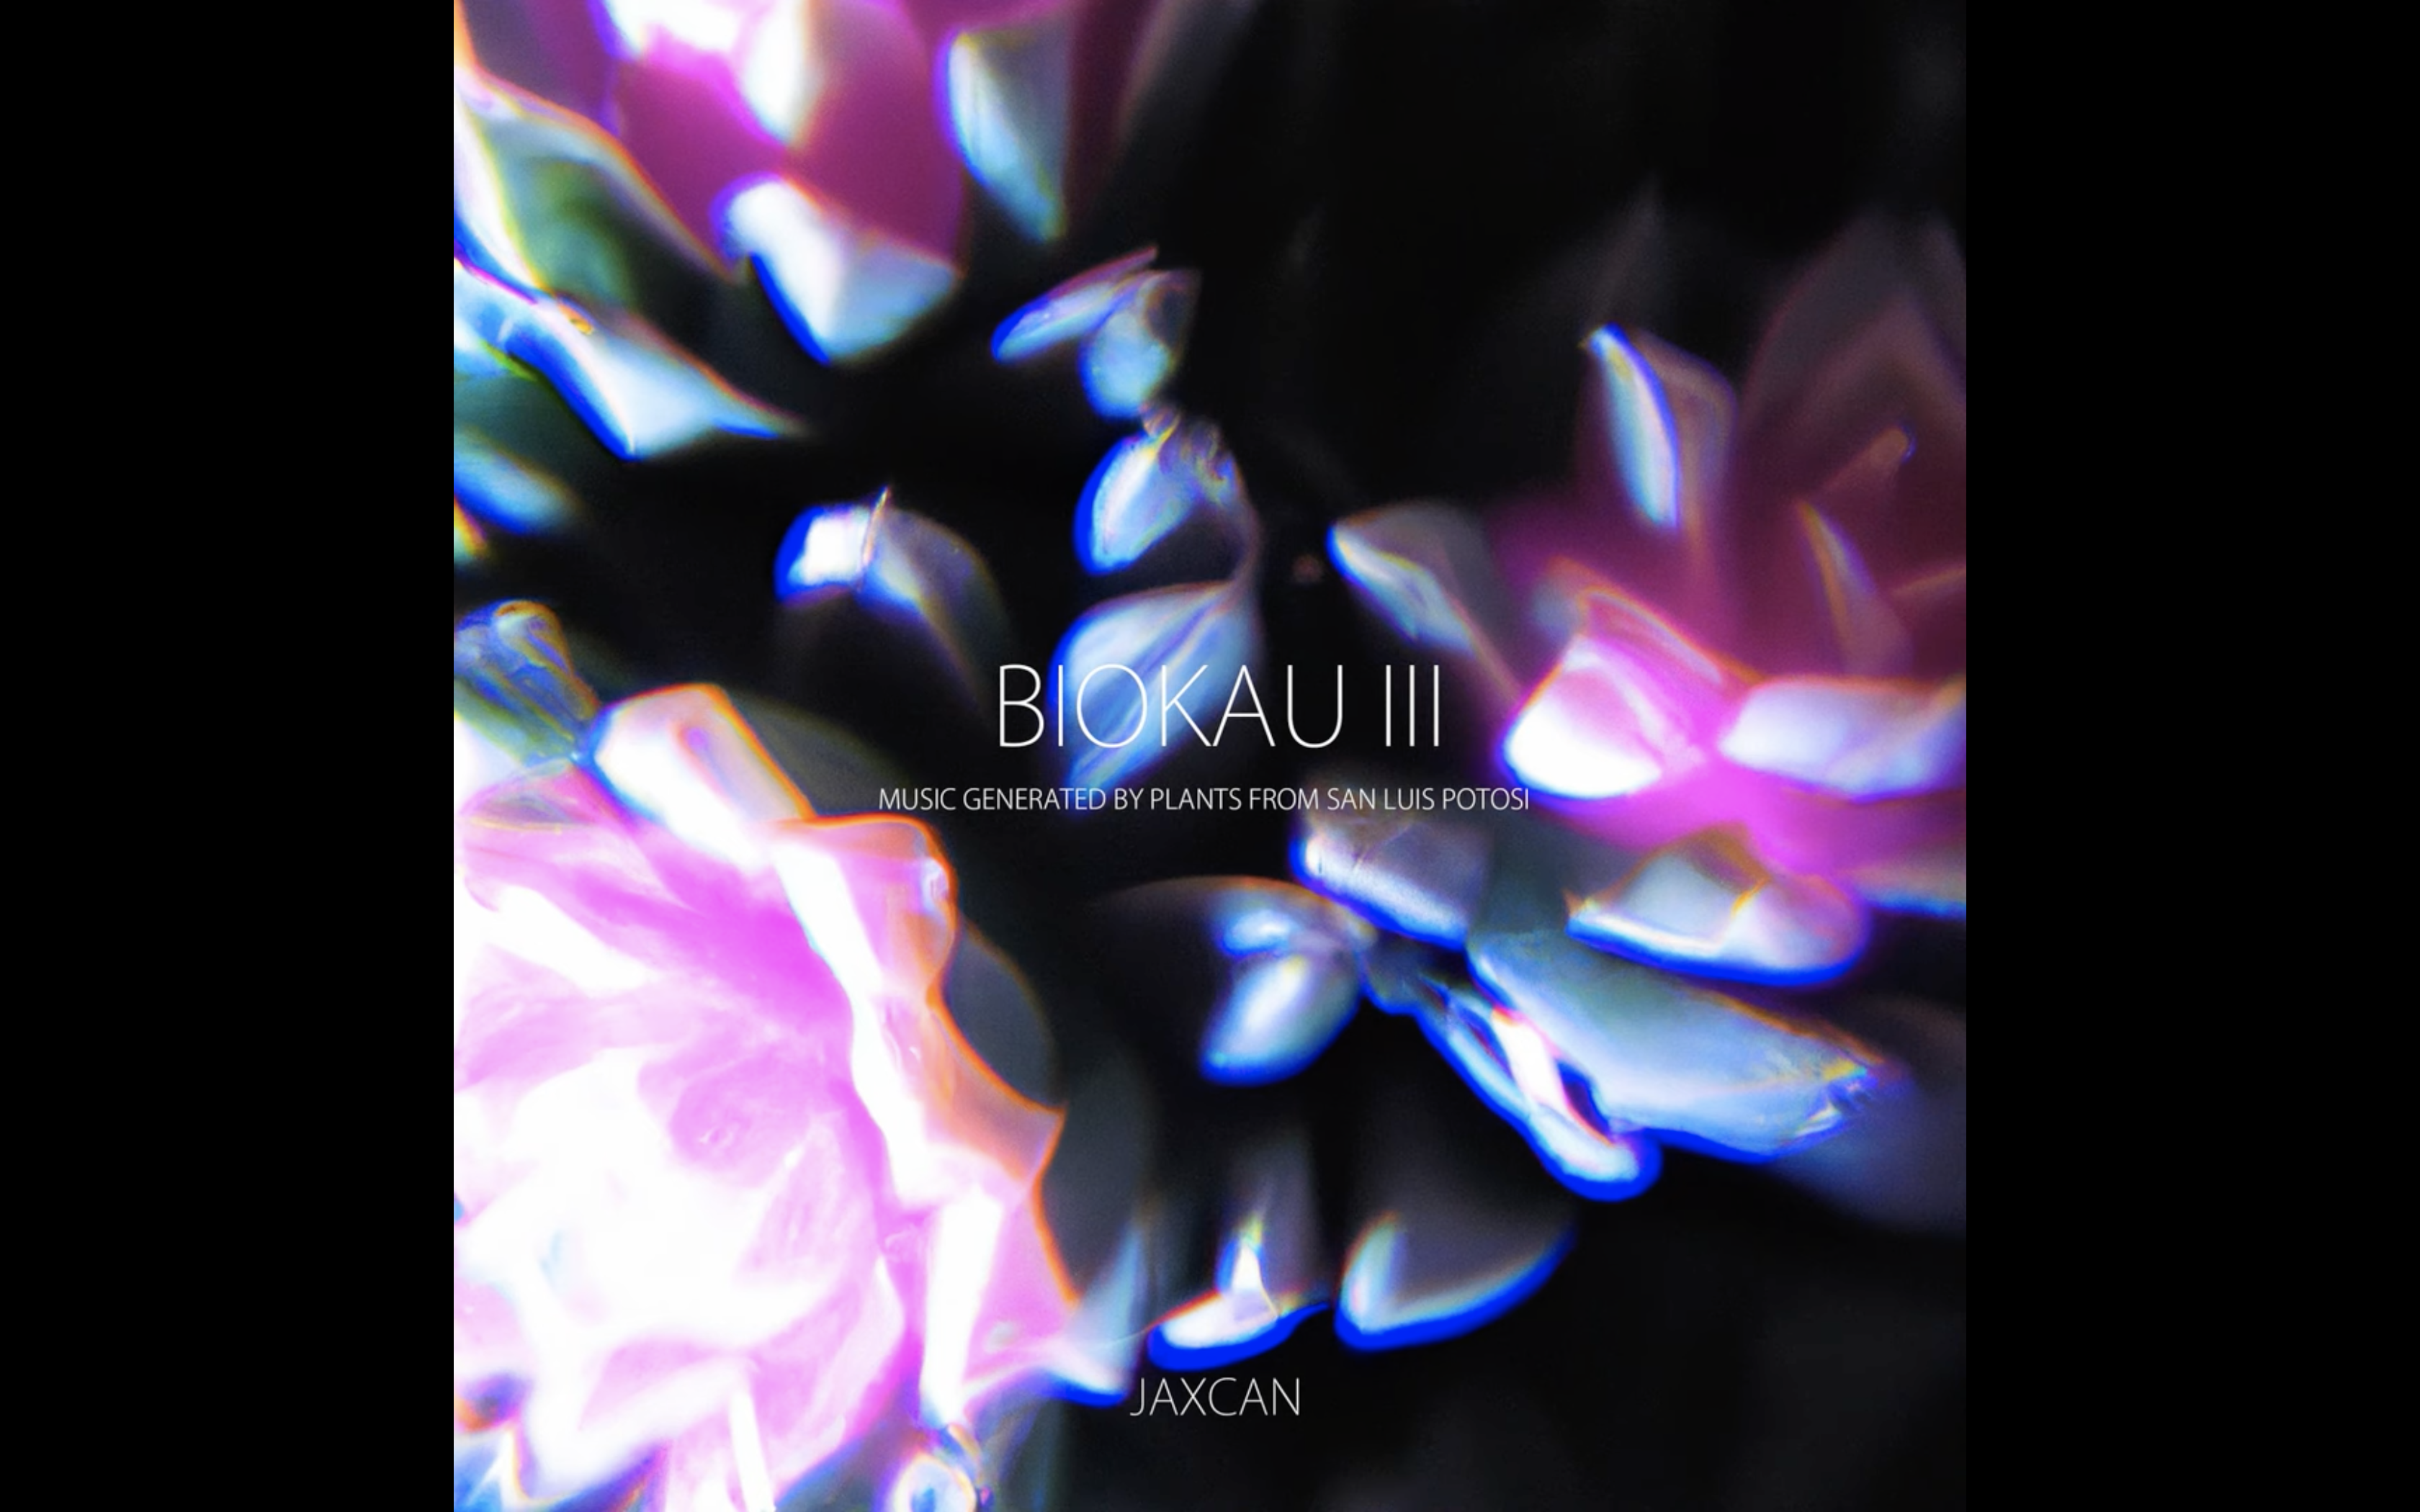
Biokāu: Music Generated by Plants From San Luis Potosí
Jalil Cervantes aka "Jaxcan"
| 2023
Award
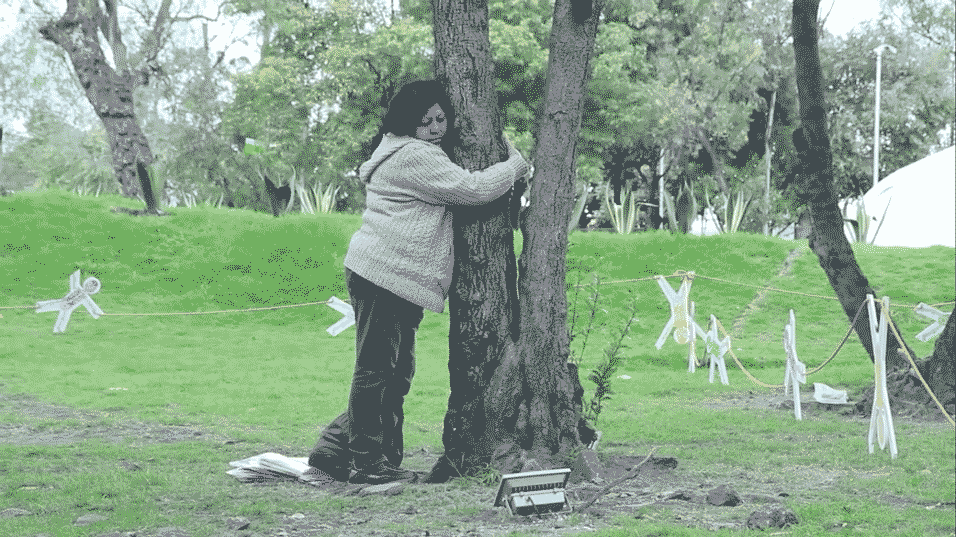
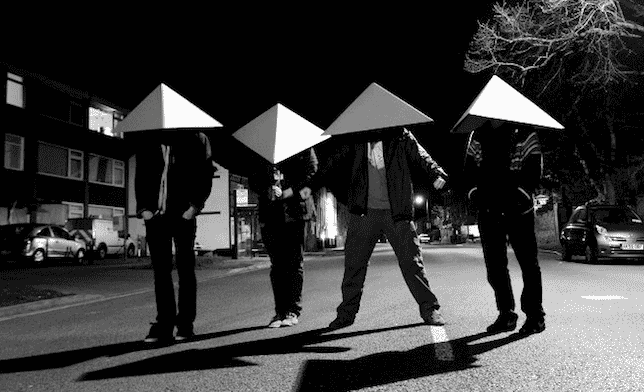
Jaxcan is an electronic artist based in San Luis Potosí, México, his work reflects on anthropocentrism and the environment, through music generated by circadian rhythms of endemic plants connected to synthesizers, generating a natural dialogue between plant and human. All species are included in the Semarnat NOM 059 of the Mexican government. The project tries to sensitize people about climate change.
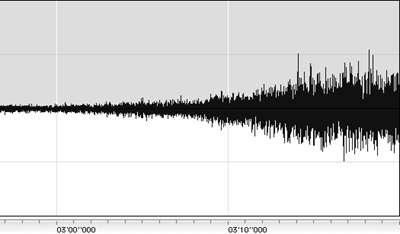
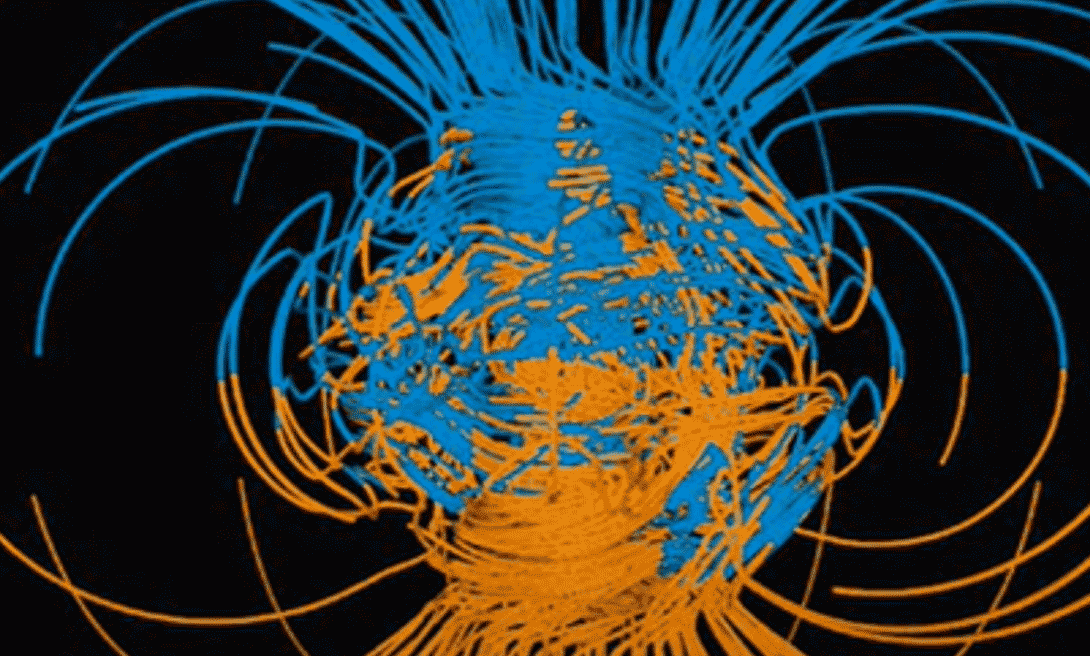
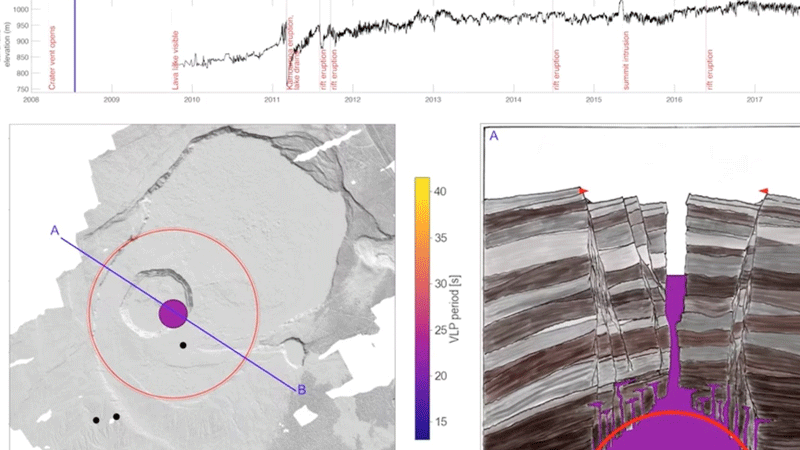
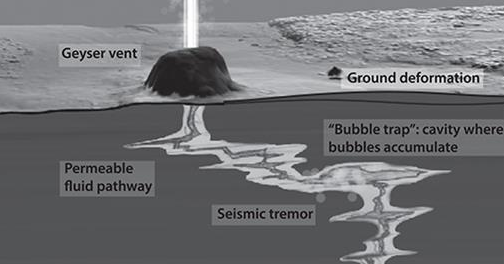
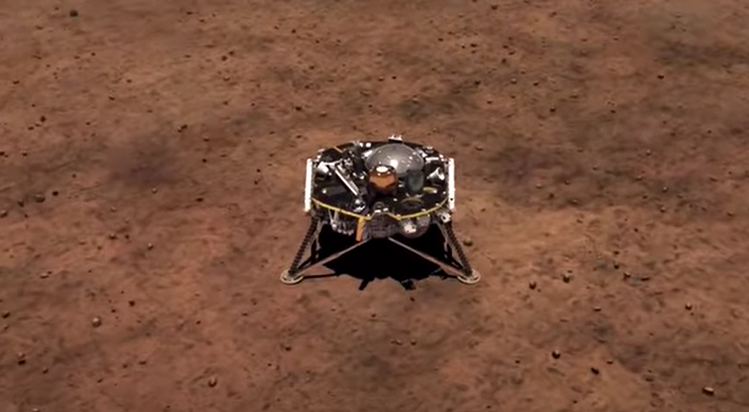
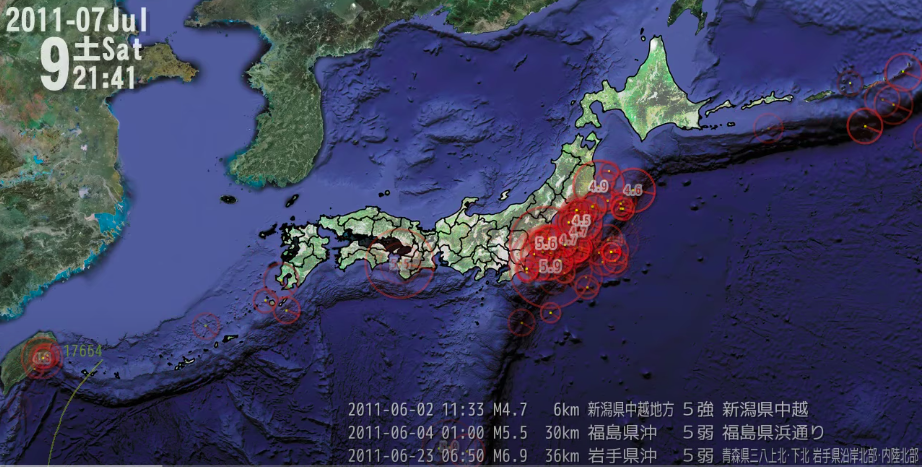
Seismic and geodetic data (three different datasets, different sonification approach for each) spanning 10 years of open vent eruption at Kilauea volcano, HI. Includes aural key.
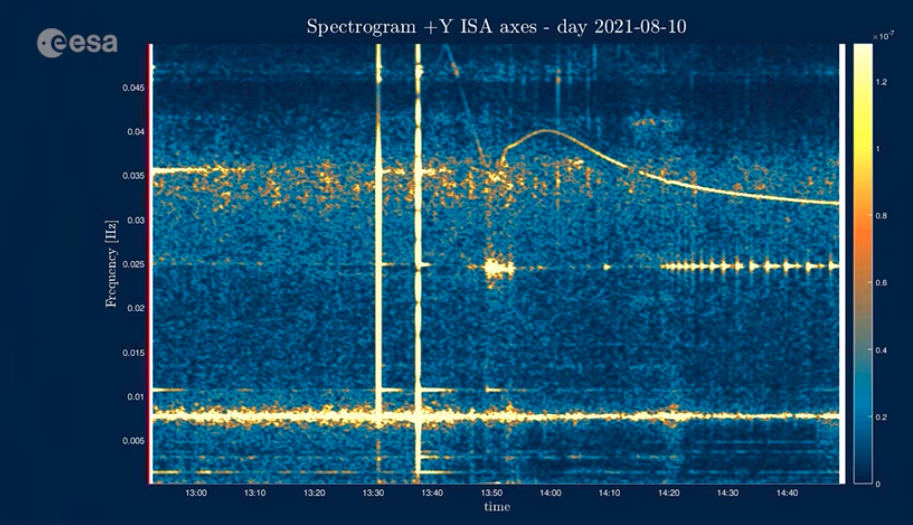
Part of the article "Earth is Noisy. Why should its data be silent"
https://eos.org/science-updates/earth-is-noisy-why-should-its-data-be-silent
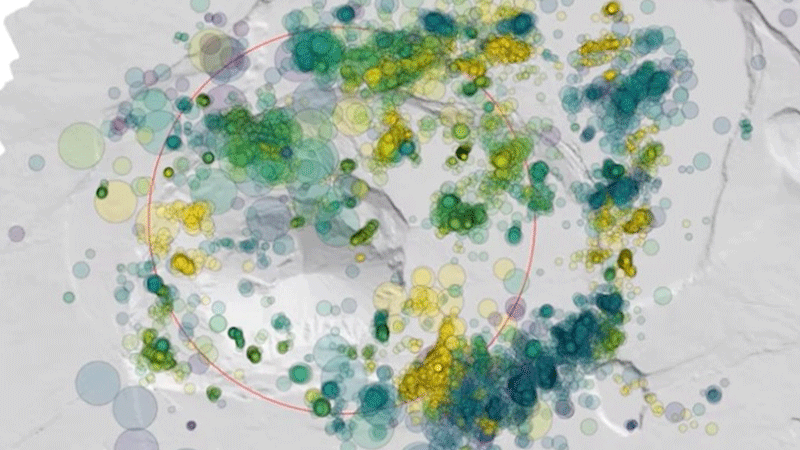
The 2018 caldera collapse sequence at Kīlauea volcano
Leif Karlstrom
| 2023
Award
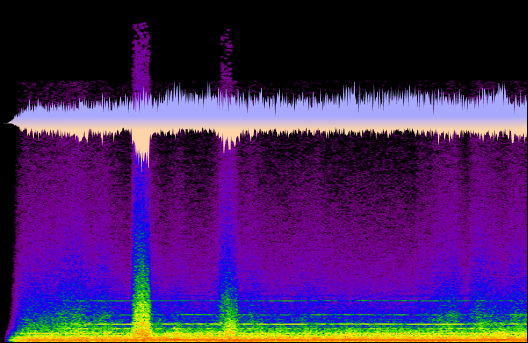
Seismic catalog data (direct sonifications of waveform data, with two speed factors to place sonified events into temporal context, then panned L/R to represent distance from listener) spanning the 2018 caldera collapse sequence at Kilauea volcano, HI. Includes aural key.
Part of the article "Earth is Noisy. Why should its data be silent"
https://eos.org/science-updates/earth-is-noisy-why-should-its-data-be-silent
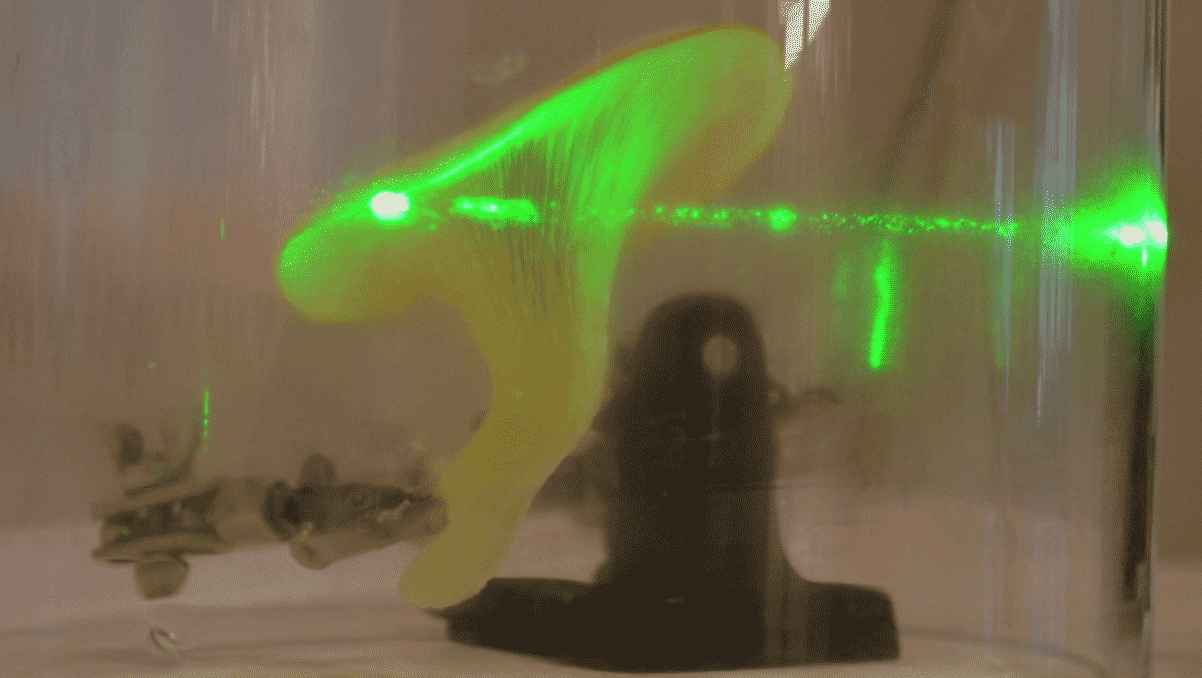
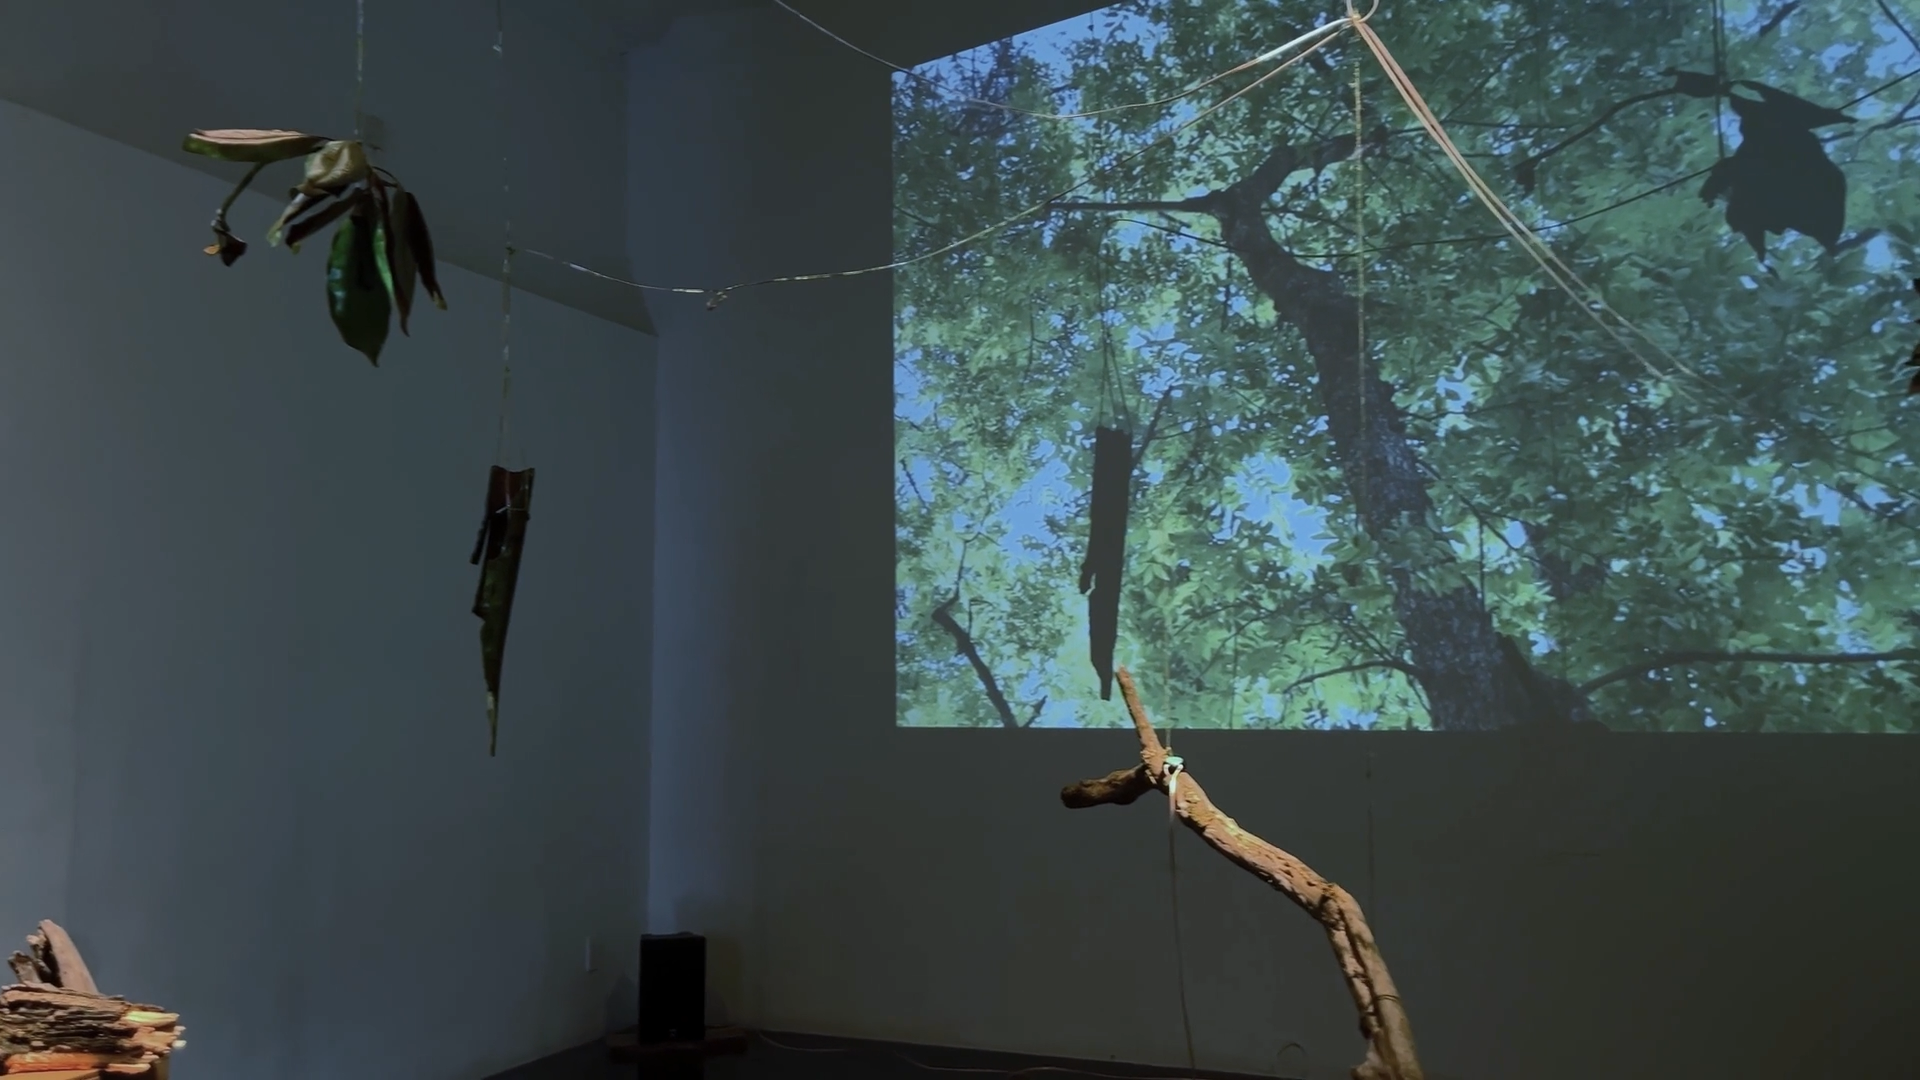
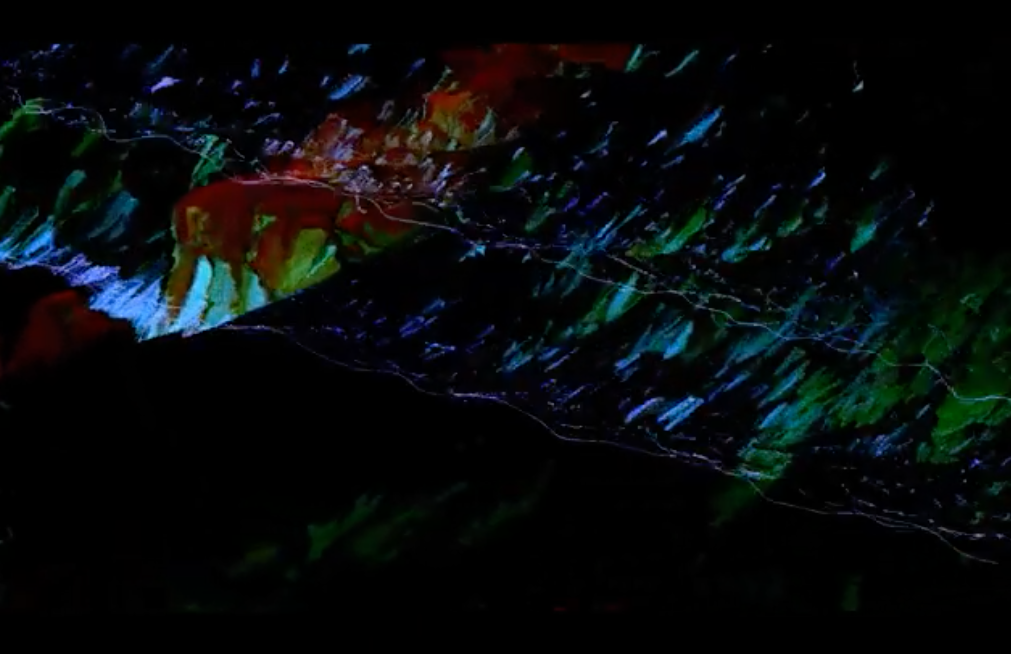
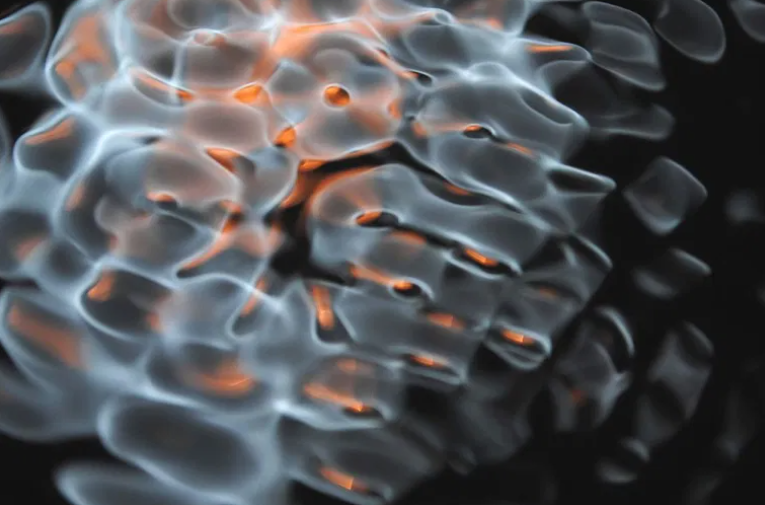
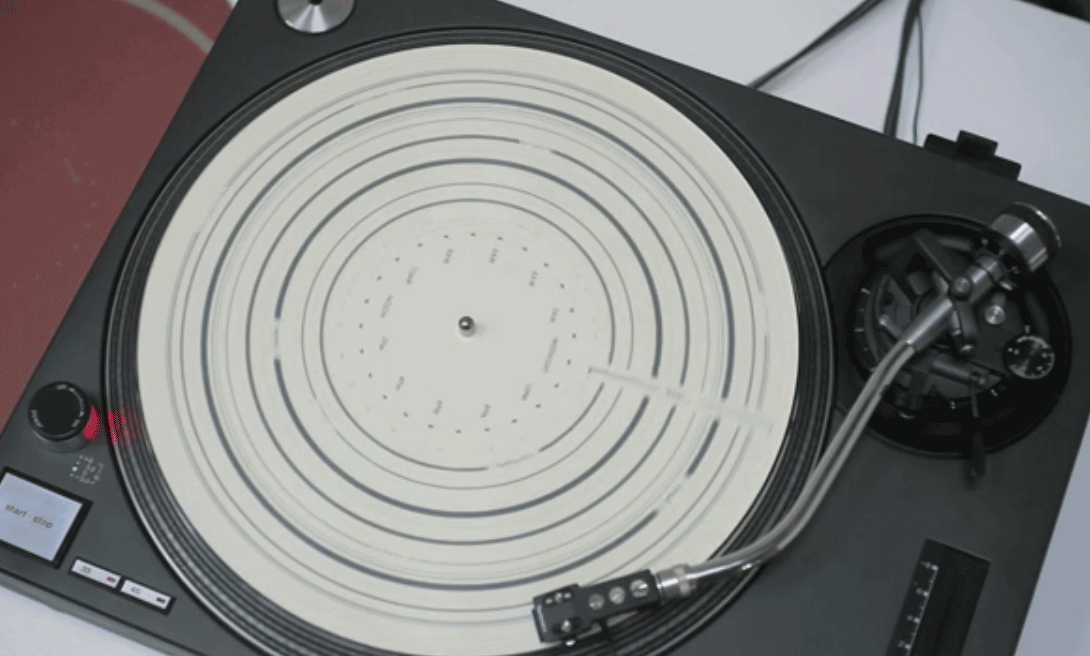
Using sensors to measure the fluctuations in electrical conductivity from botanical specimens, yields audible rhythmic and melodic information when processed through a digital audio workstation. The biodata is then amplified through a low-frequency vibration generator beneath paper, imbuing fine raw pigments into a state of perceived automatism upon the paper. The emergent patterns are governed by a naturally occurring phenomenon known as cymatics - the occurrence of sound made visible - where nodal and antinodal patterns are shaped by resonance and vibration. The autonomous mark making of pigments and crossover patterns reveal an abstract impressionistic landscape; a nod to the source itself. In processing the sonification inherent in botanicals, and using that biodata to autonomously “paint” resonant patterns, we can view this work as a generative instance. Furthermore, the “randomness” of the rhythmic pattern that resonates onto the paper, is determined by the health and chemistry of the plant, as well as the environmental factors (temperature, time of day): these parameters allow the form to emerge. Nature IS the algorithm. To set the image, for hours my kabuki brush swirls the emergent patterns of pigment into the paper, rendering a gaussian blur as each colour graduates into the other. I enjoy the physicality and meditative surrender as I trace the made marks into lush gradients with my brush, with full trust in the guidance from its source. I view the work as an intimate collaboration between nature, its hidden intrinsic energetic code, and myself. The work is a testament to my ongoing dedication to "nature as muse".
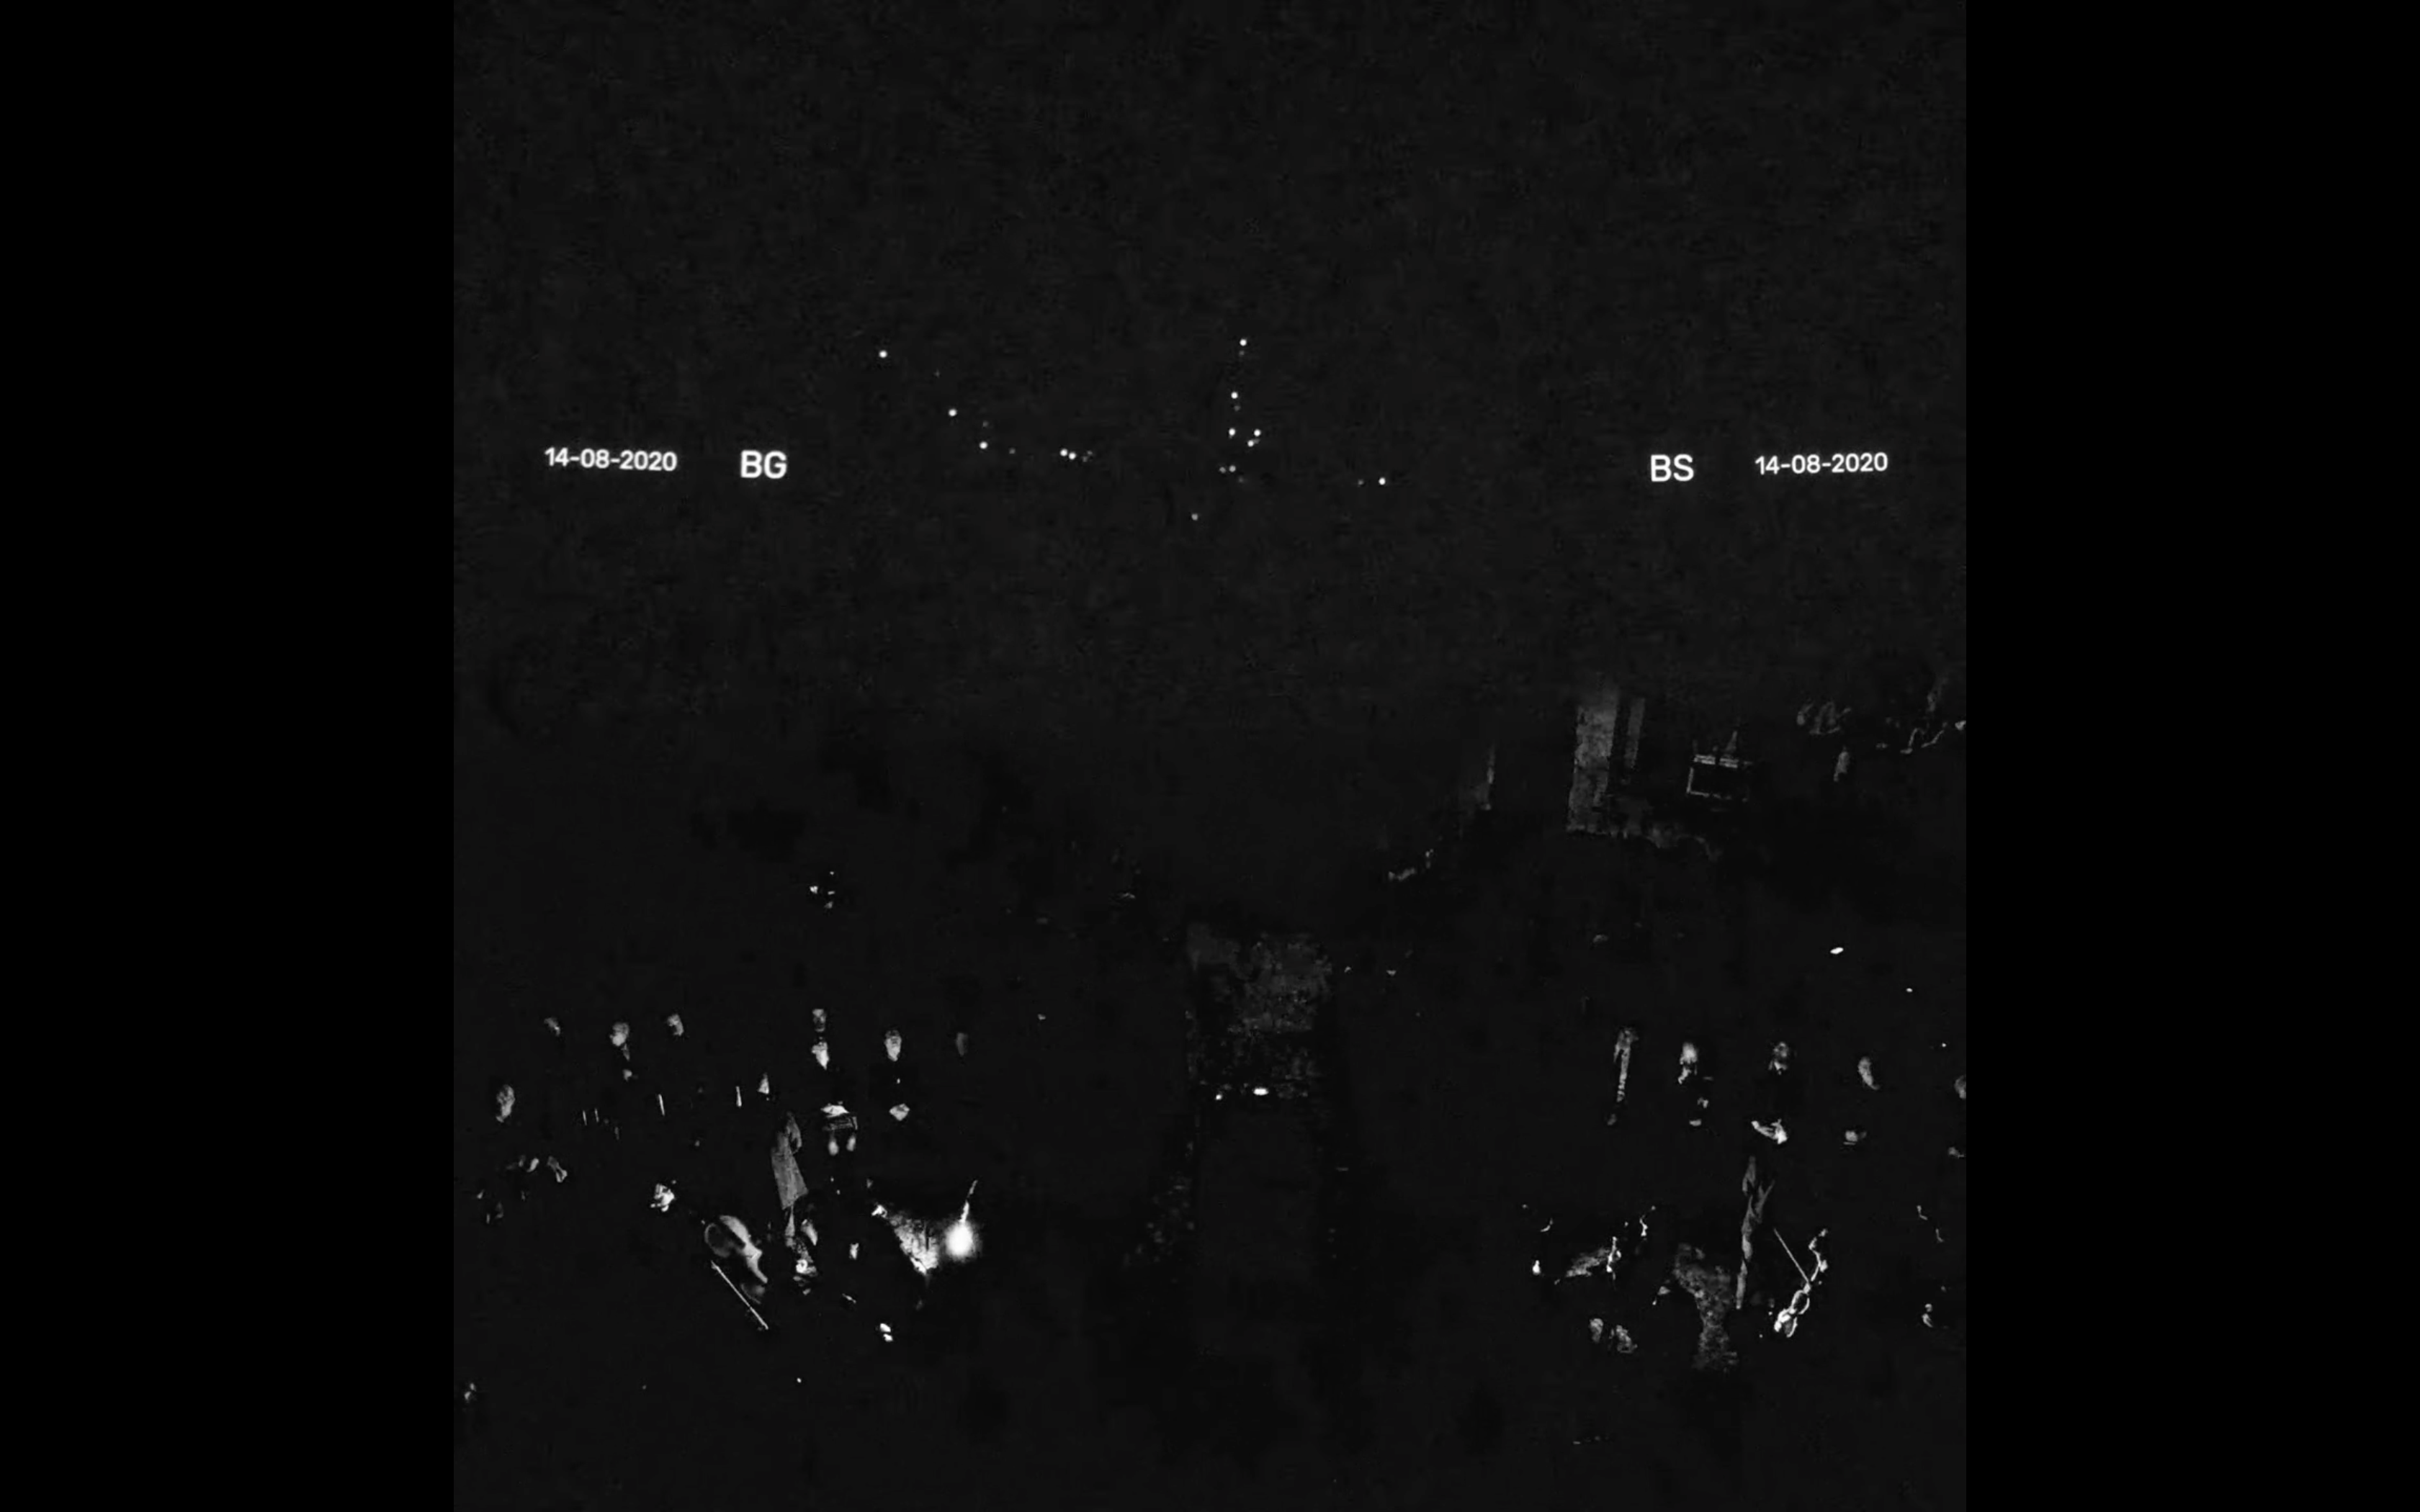
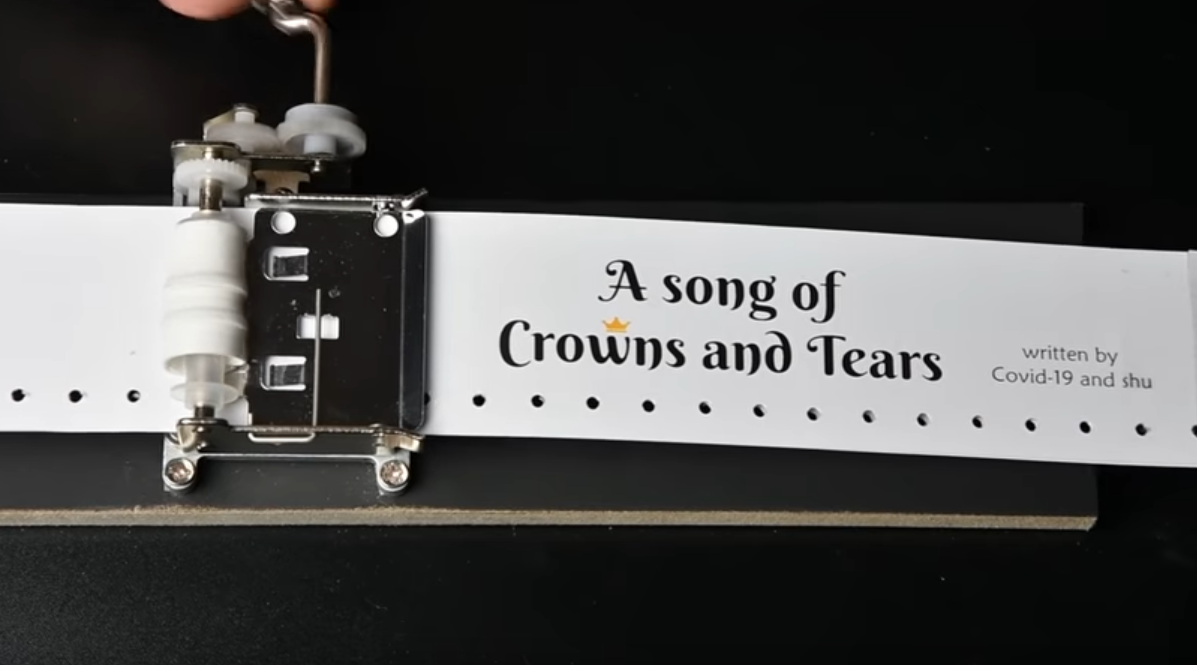
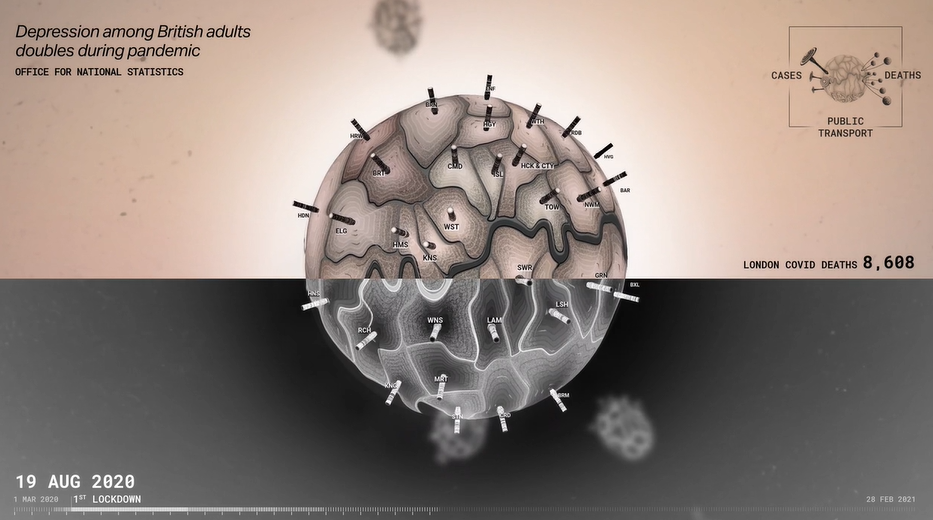
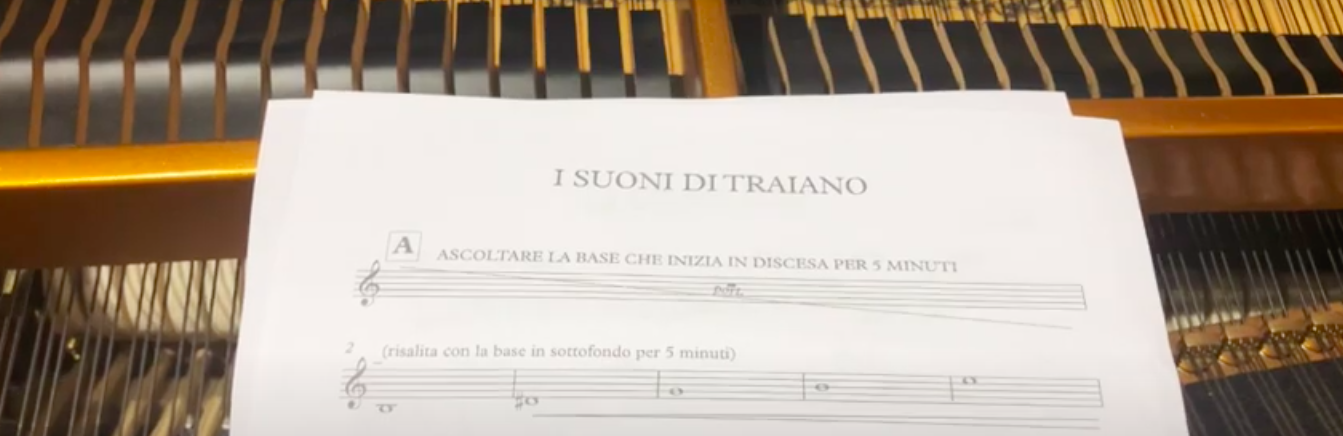
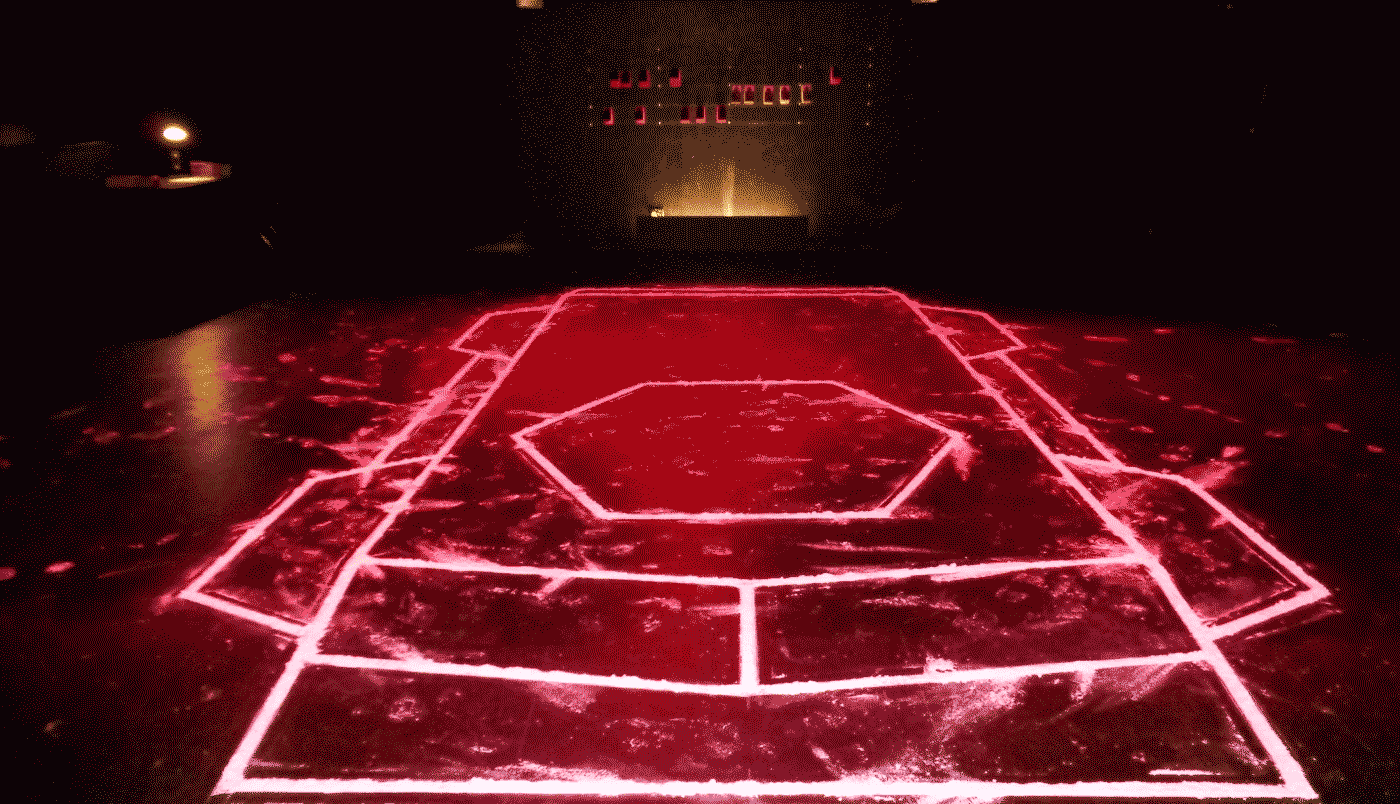
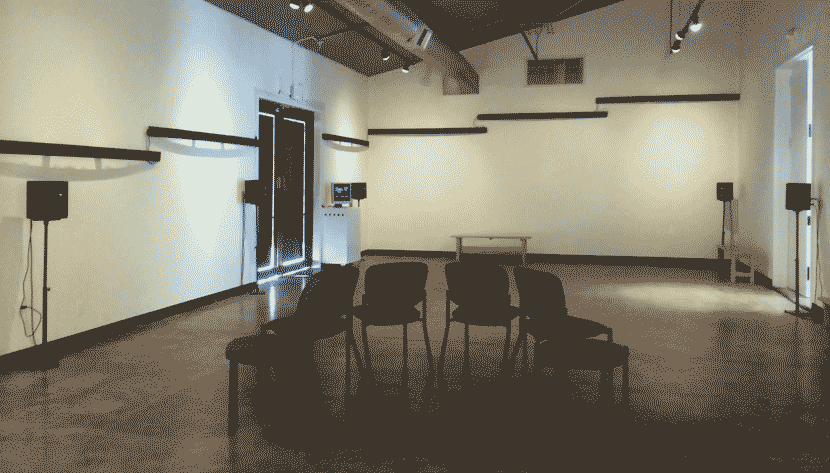
Land Music is a territory-specific data-driven performance created for Bergamo Brescia Capitale Italiana della Cultura 2023. It consists in making all the bell towers present on the over 7,500km2 of territory simultaneously concerted; resulting in the spatially largest concert ever performed
At 8pm each bell tower rang and performed a number of strokes equal to the victims caused by the pandemic in the parishes and municipalities which the bell tower belongs to. This will create an "extended concert" which will symbolically unite the two provinces.
Land Music happened on March 18, 2023, the national day in memory of the victims of Covid.
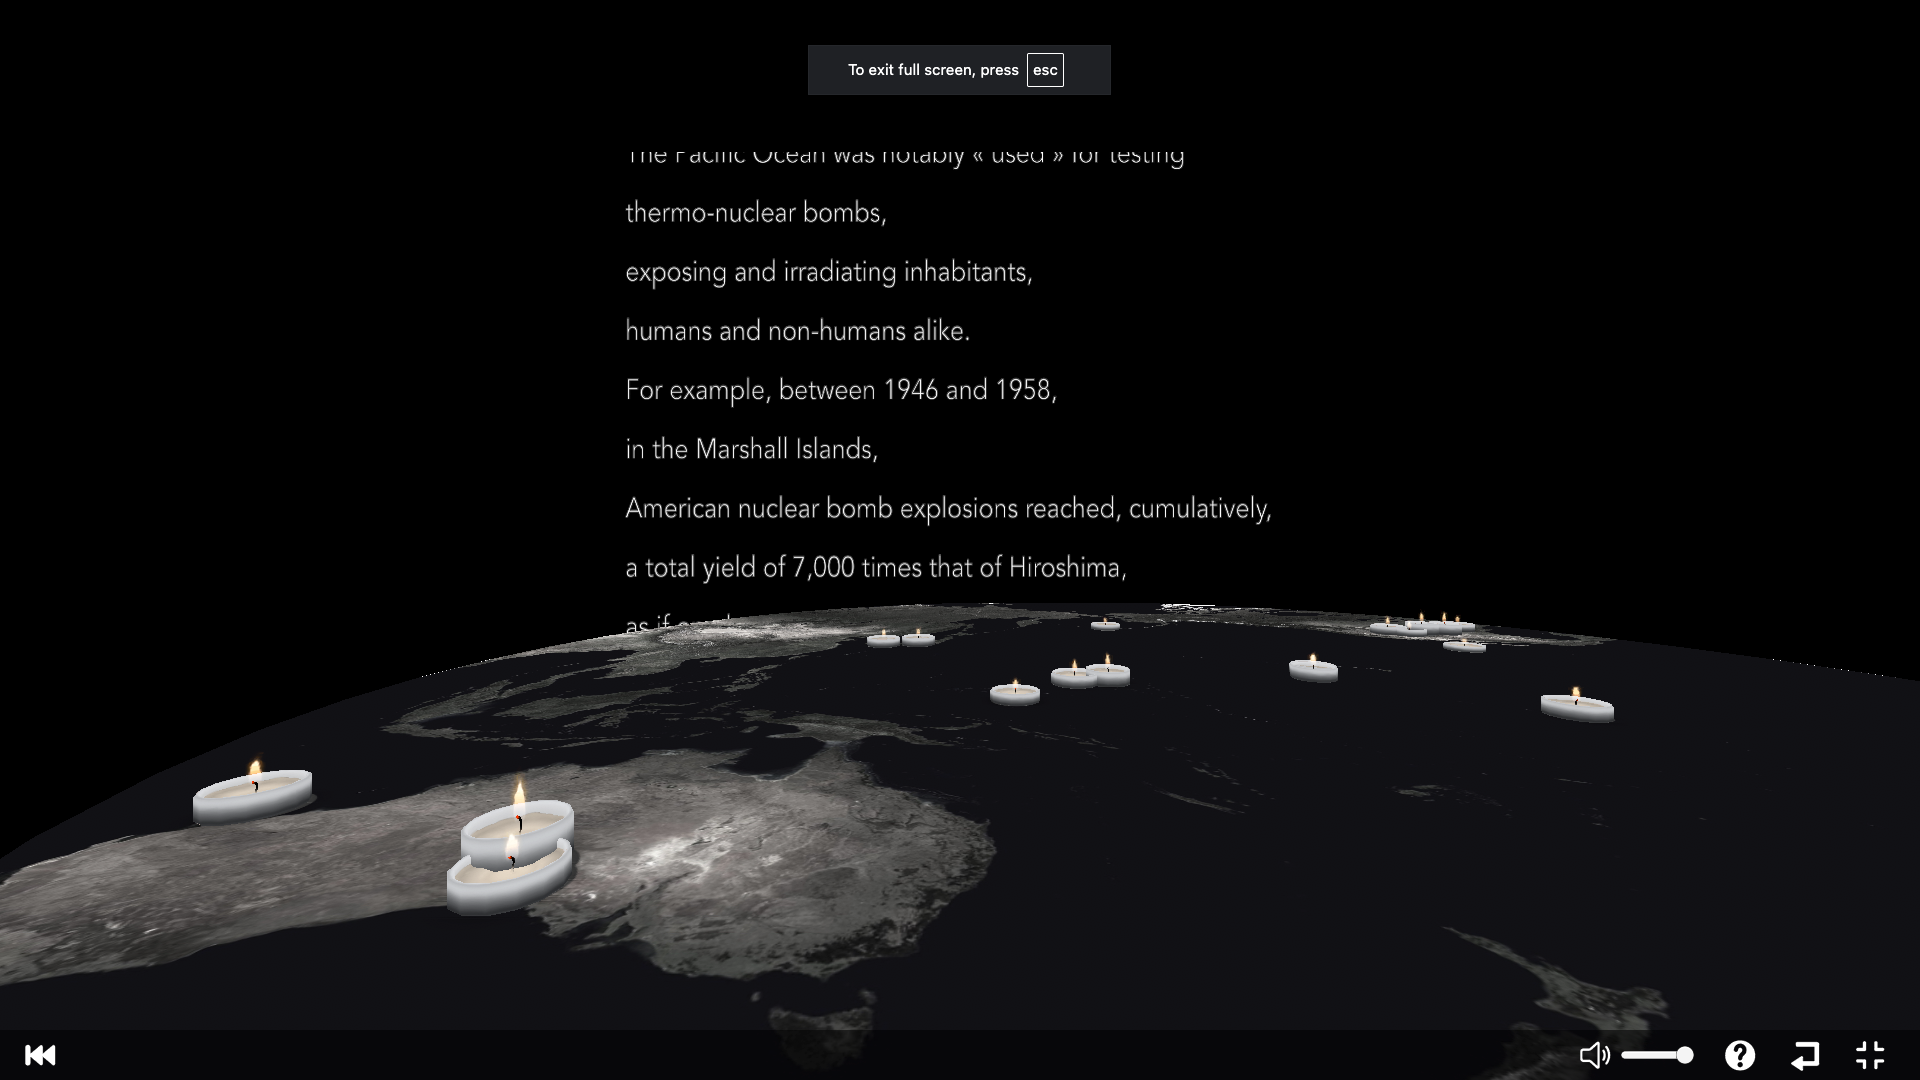
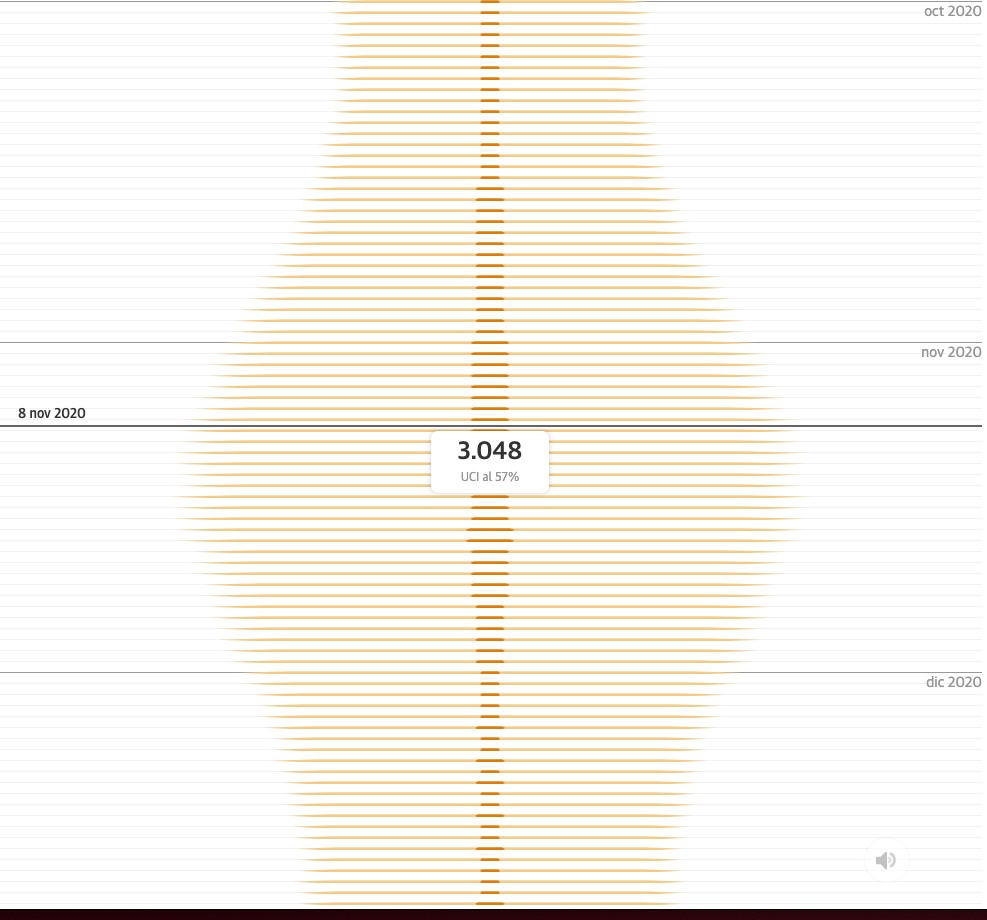
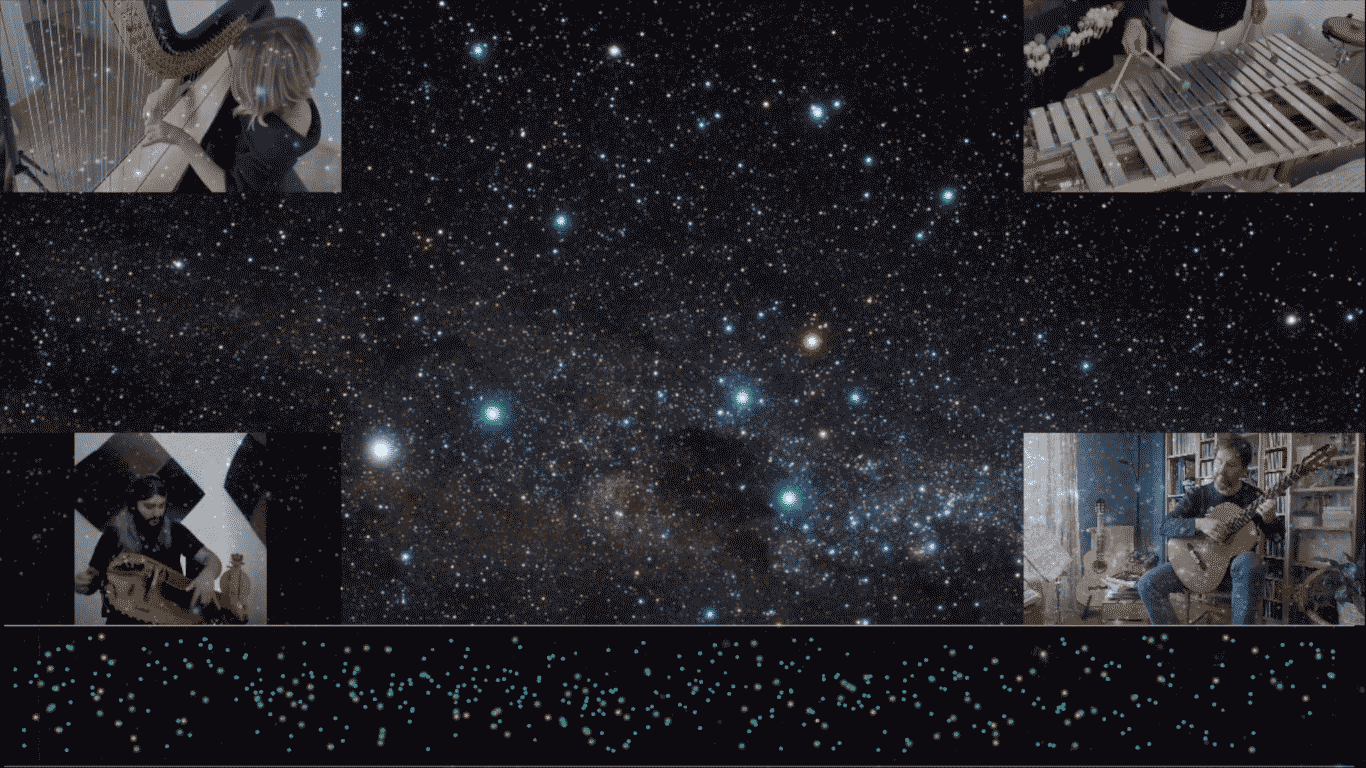
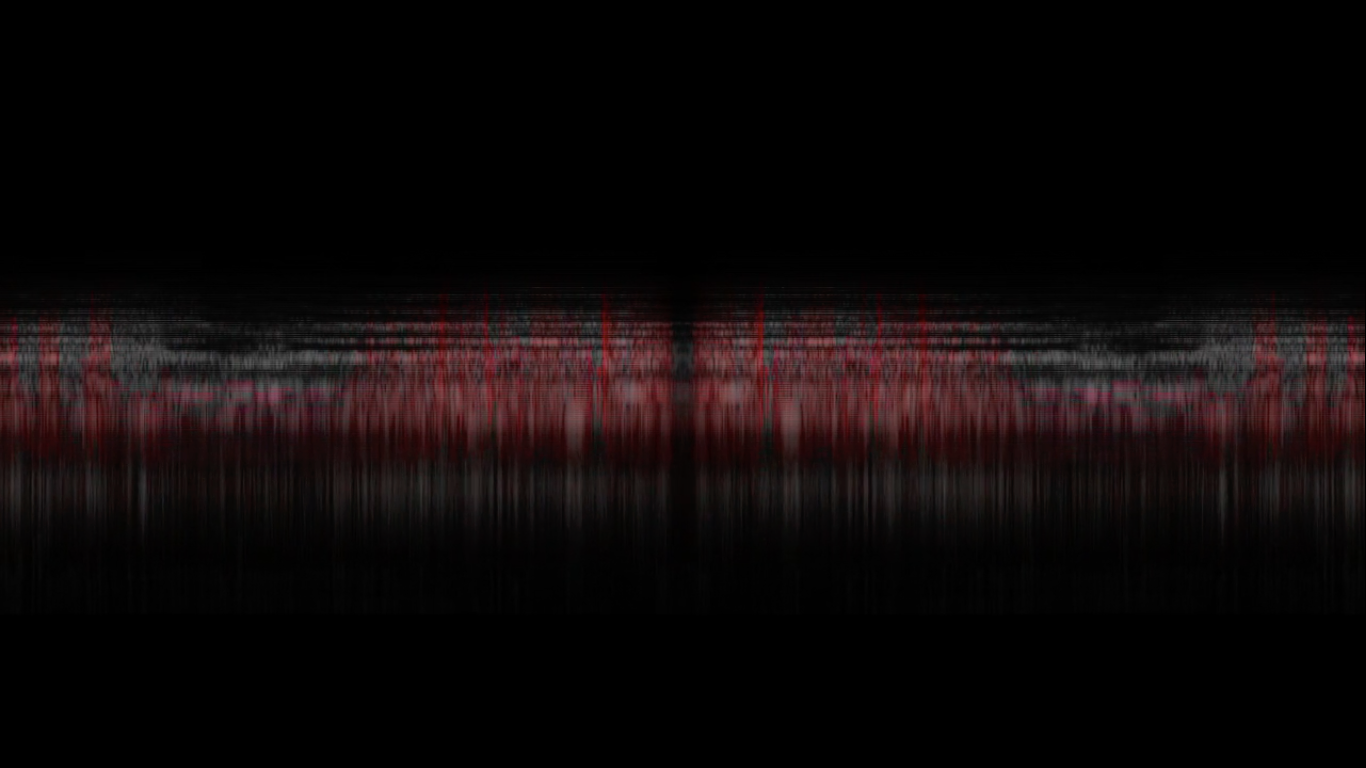
Requiem448 is a multimedia work of generative art and data sonification based on the Covid-19 data from Bergamo and Brescia, created by Nessun Dharma.
It is numerically generated using the Istat database, which contains information about the Covid-19 victims in the provinces of Bergamo and Brescia. In the temporal development of the audiovisual flow, each second of the piece corresponds to a day, from January 1, 2020, to March 18, 2022, which marked the first celebration of the national day established in memory of the pandemic victims. The number of sound and visual events per second equals the number of deaths that day. The dramatic development of the work follows moments of high intensity caused by the so-called "waves" and moments of relative calm.
The aesthetics of Requiem448 combine polyrhythms of idiophone timbres with data visualization.
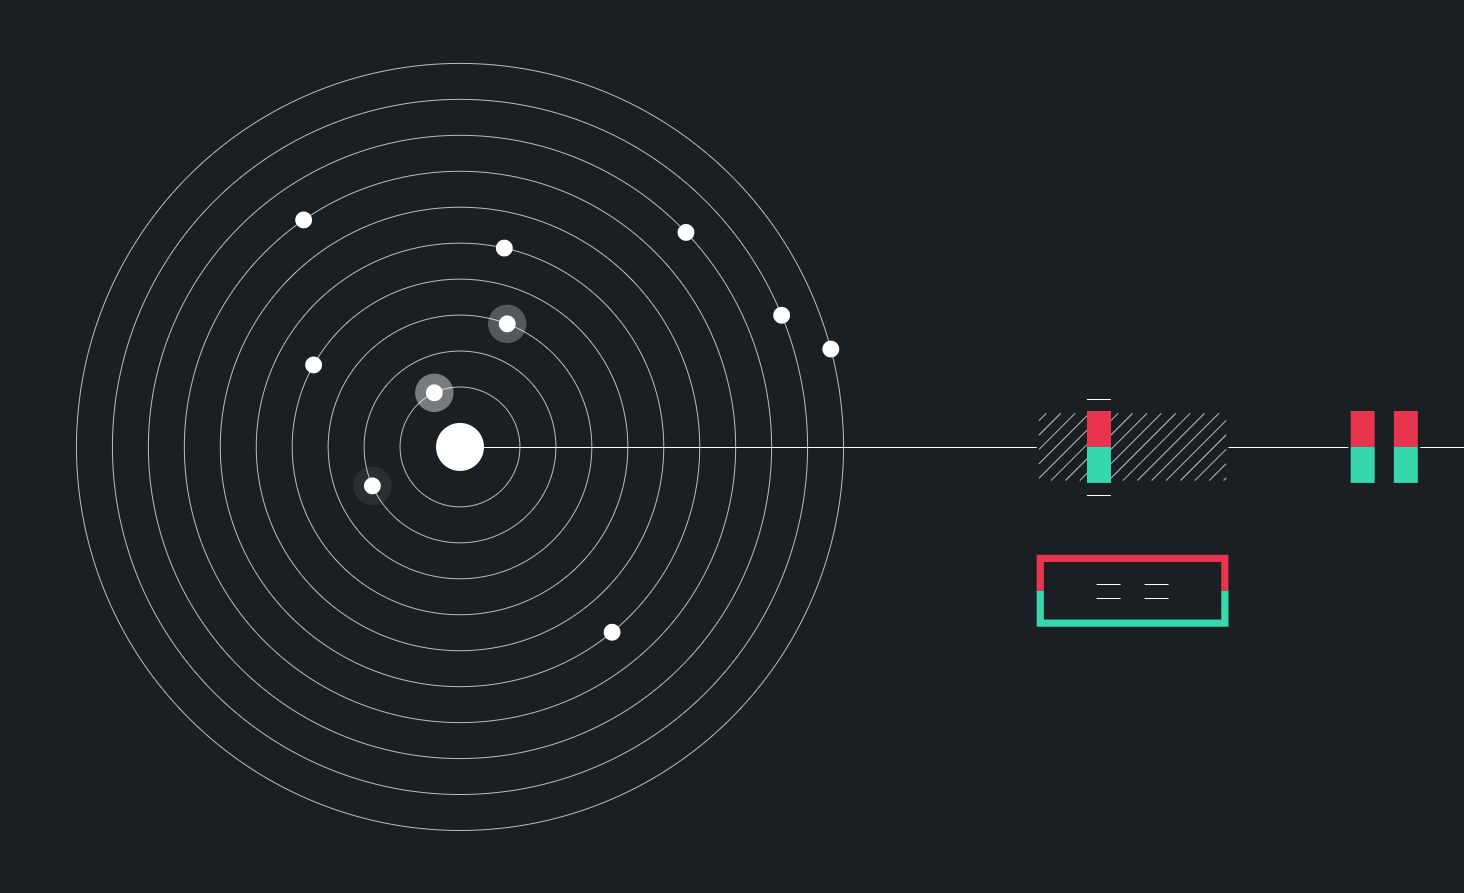
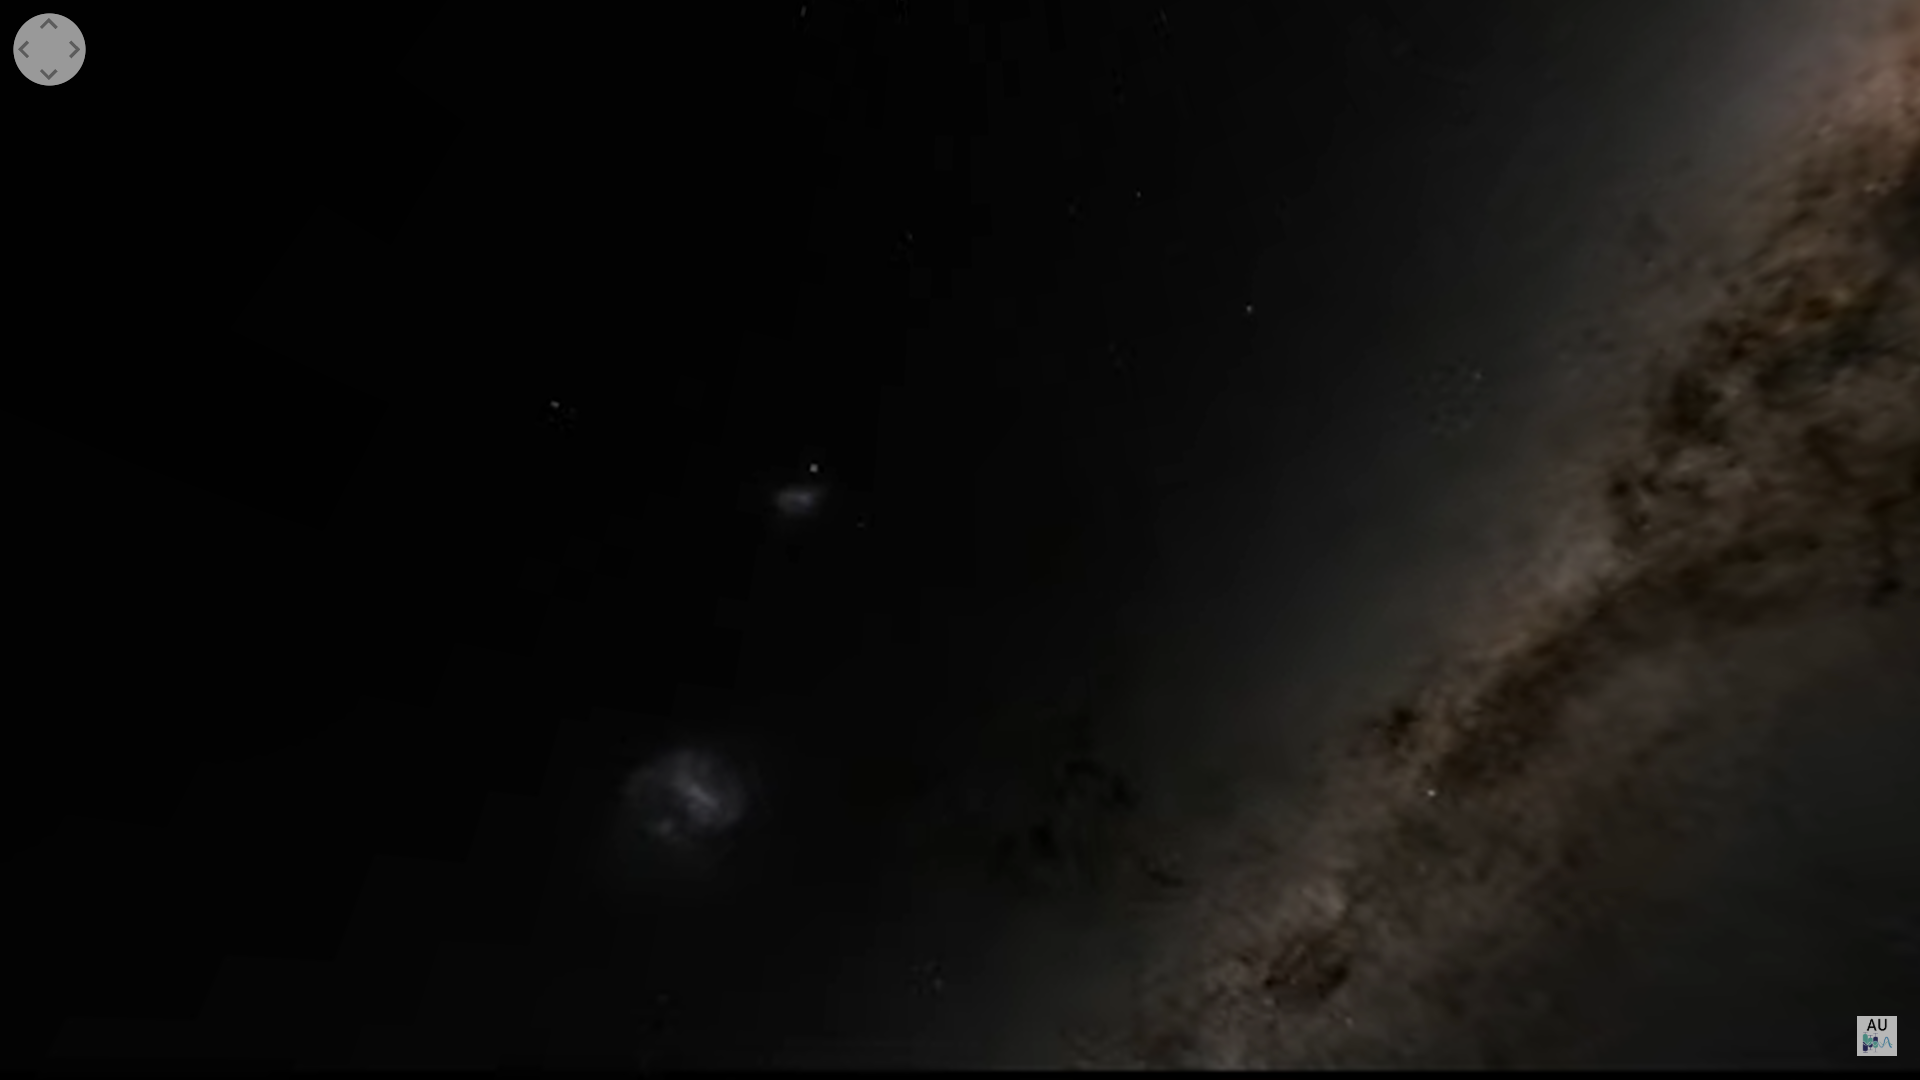
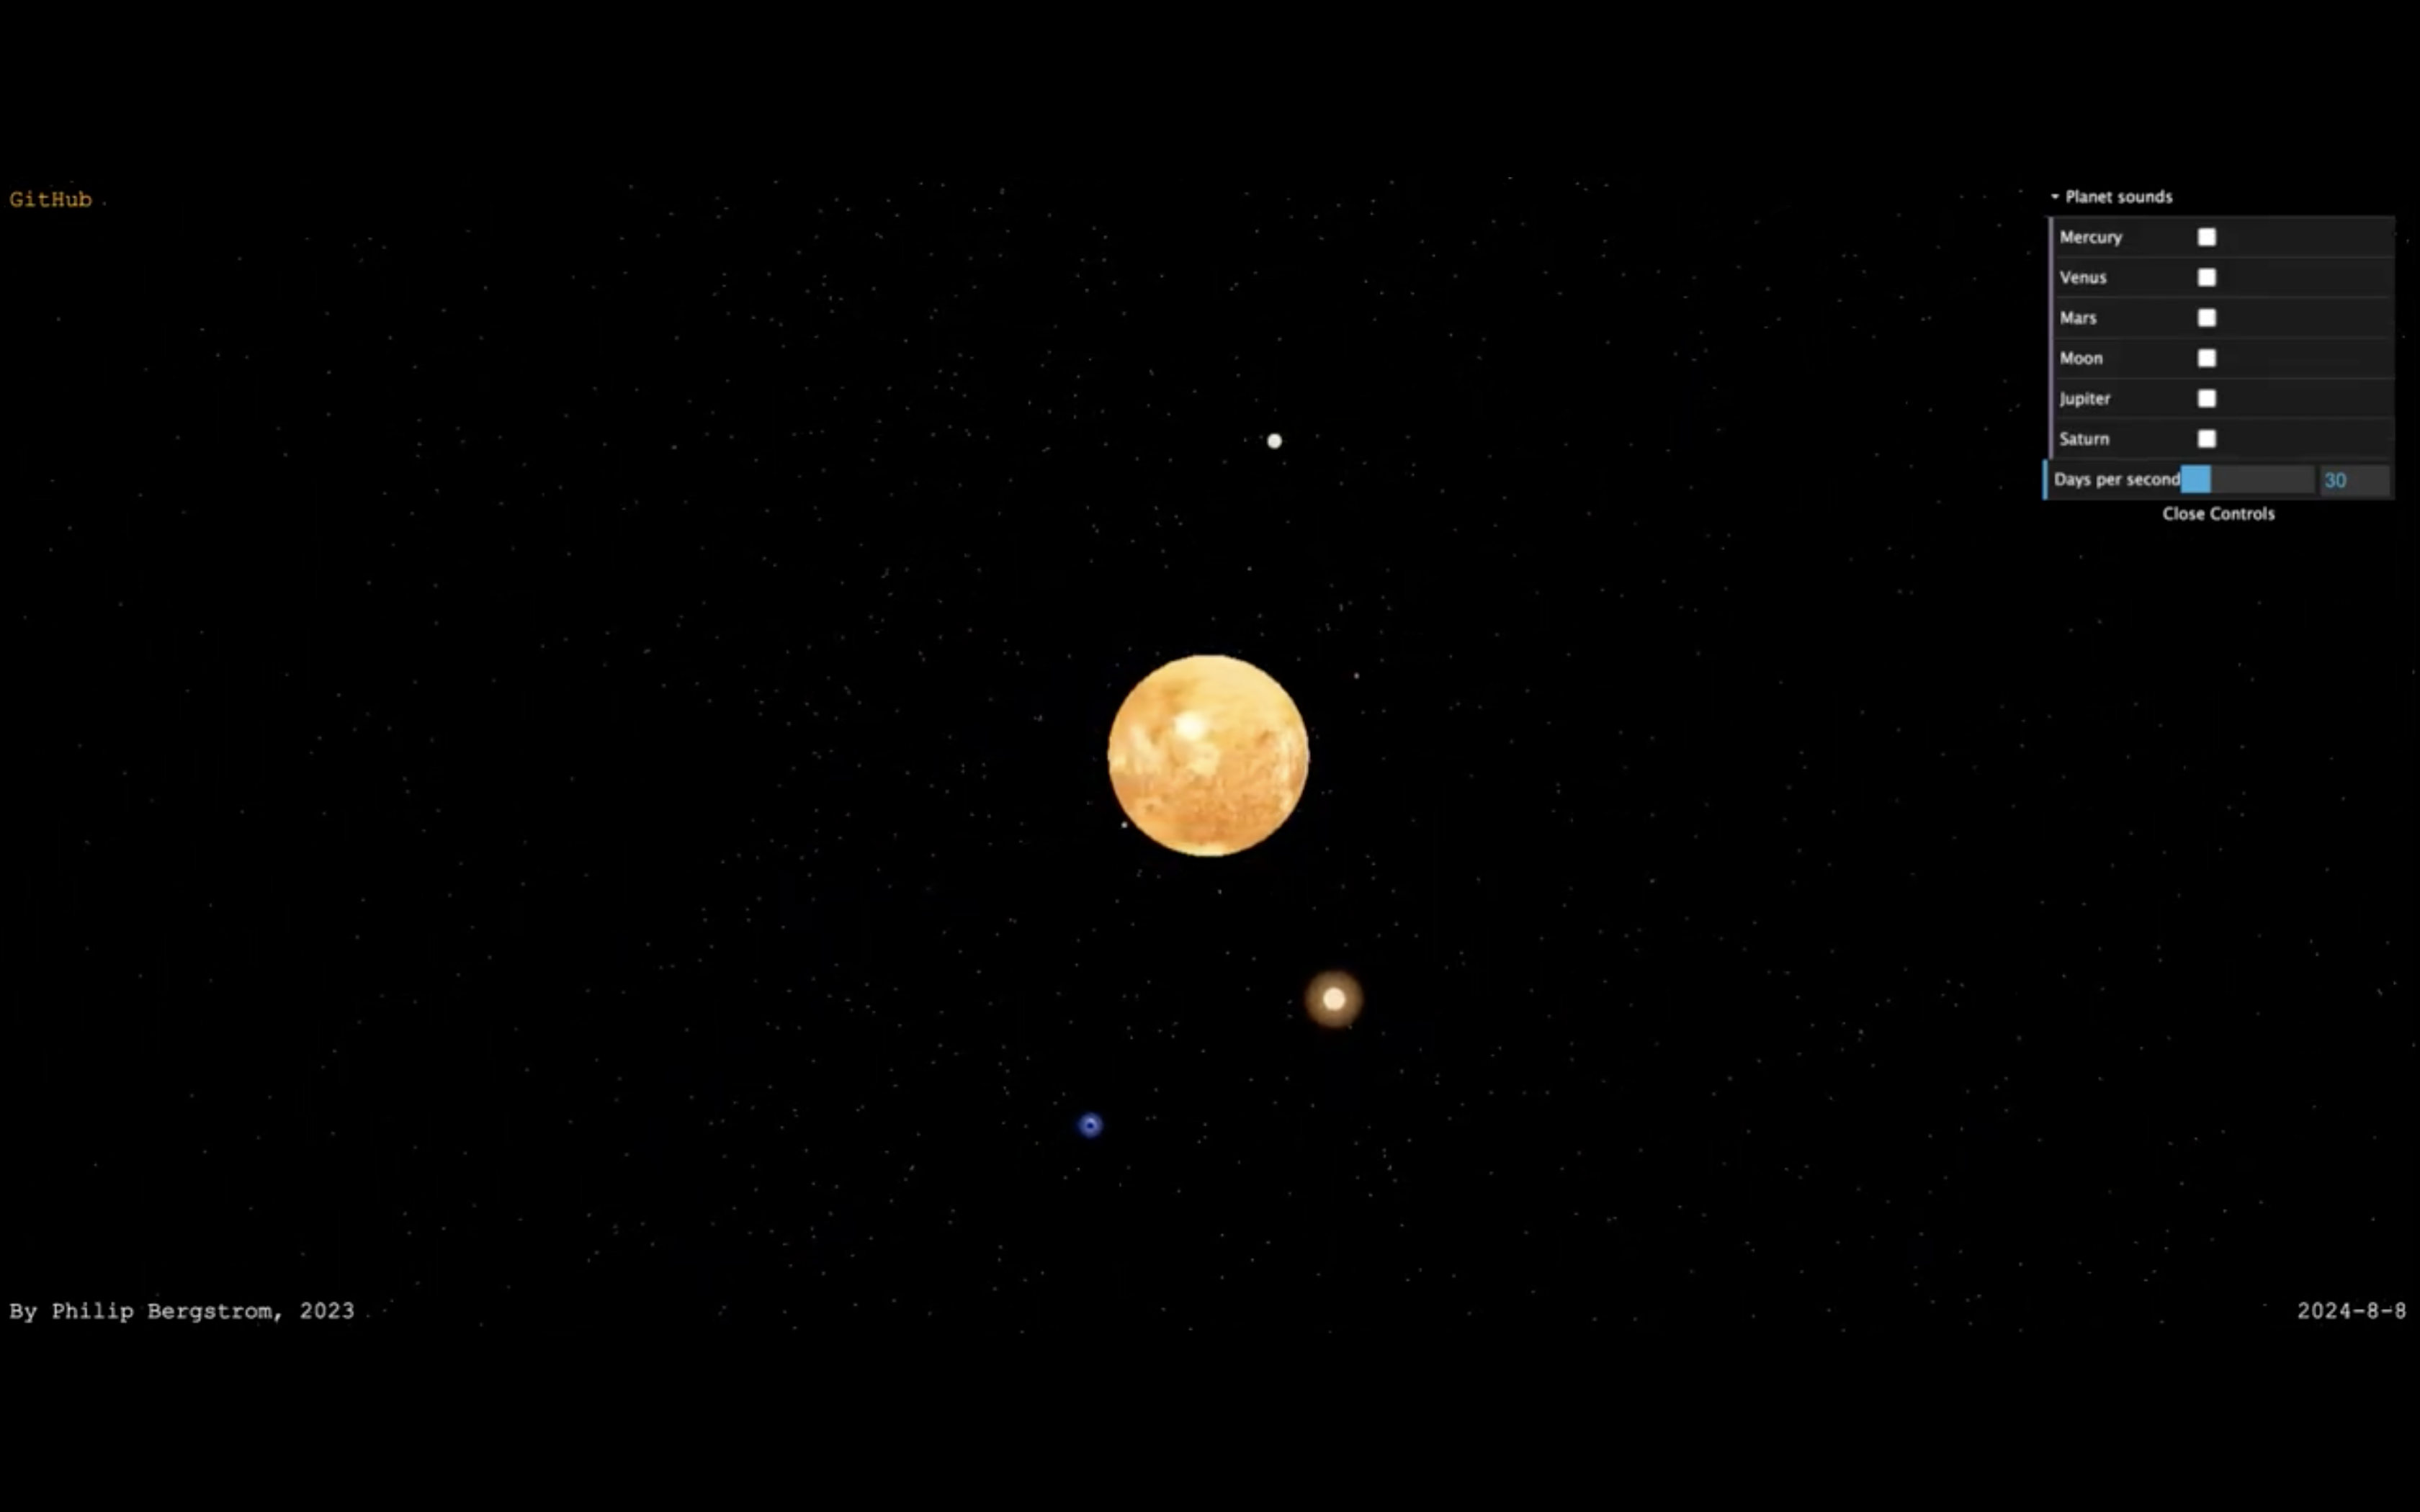
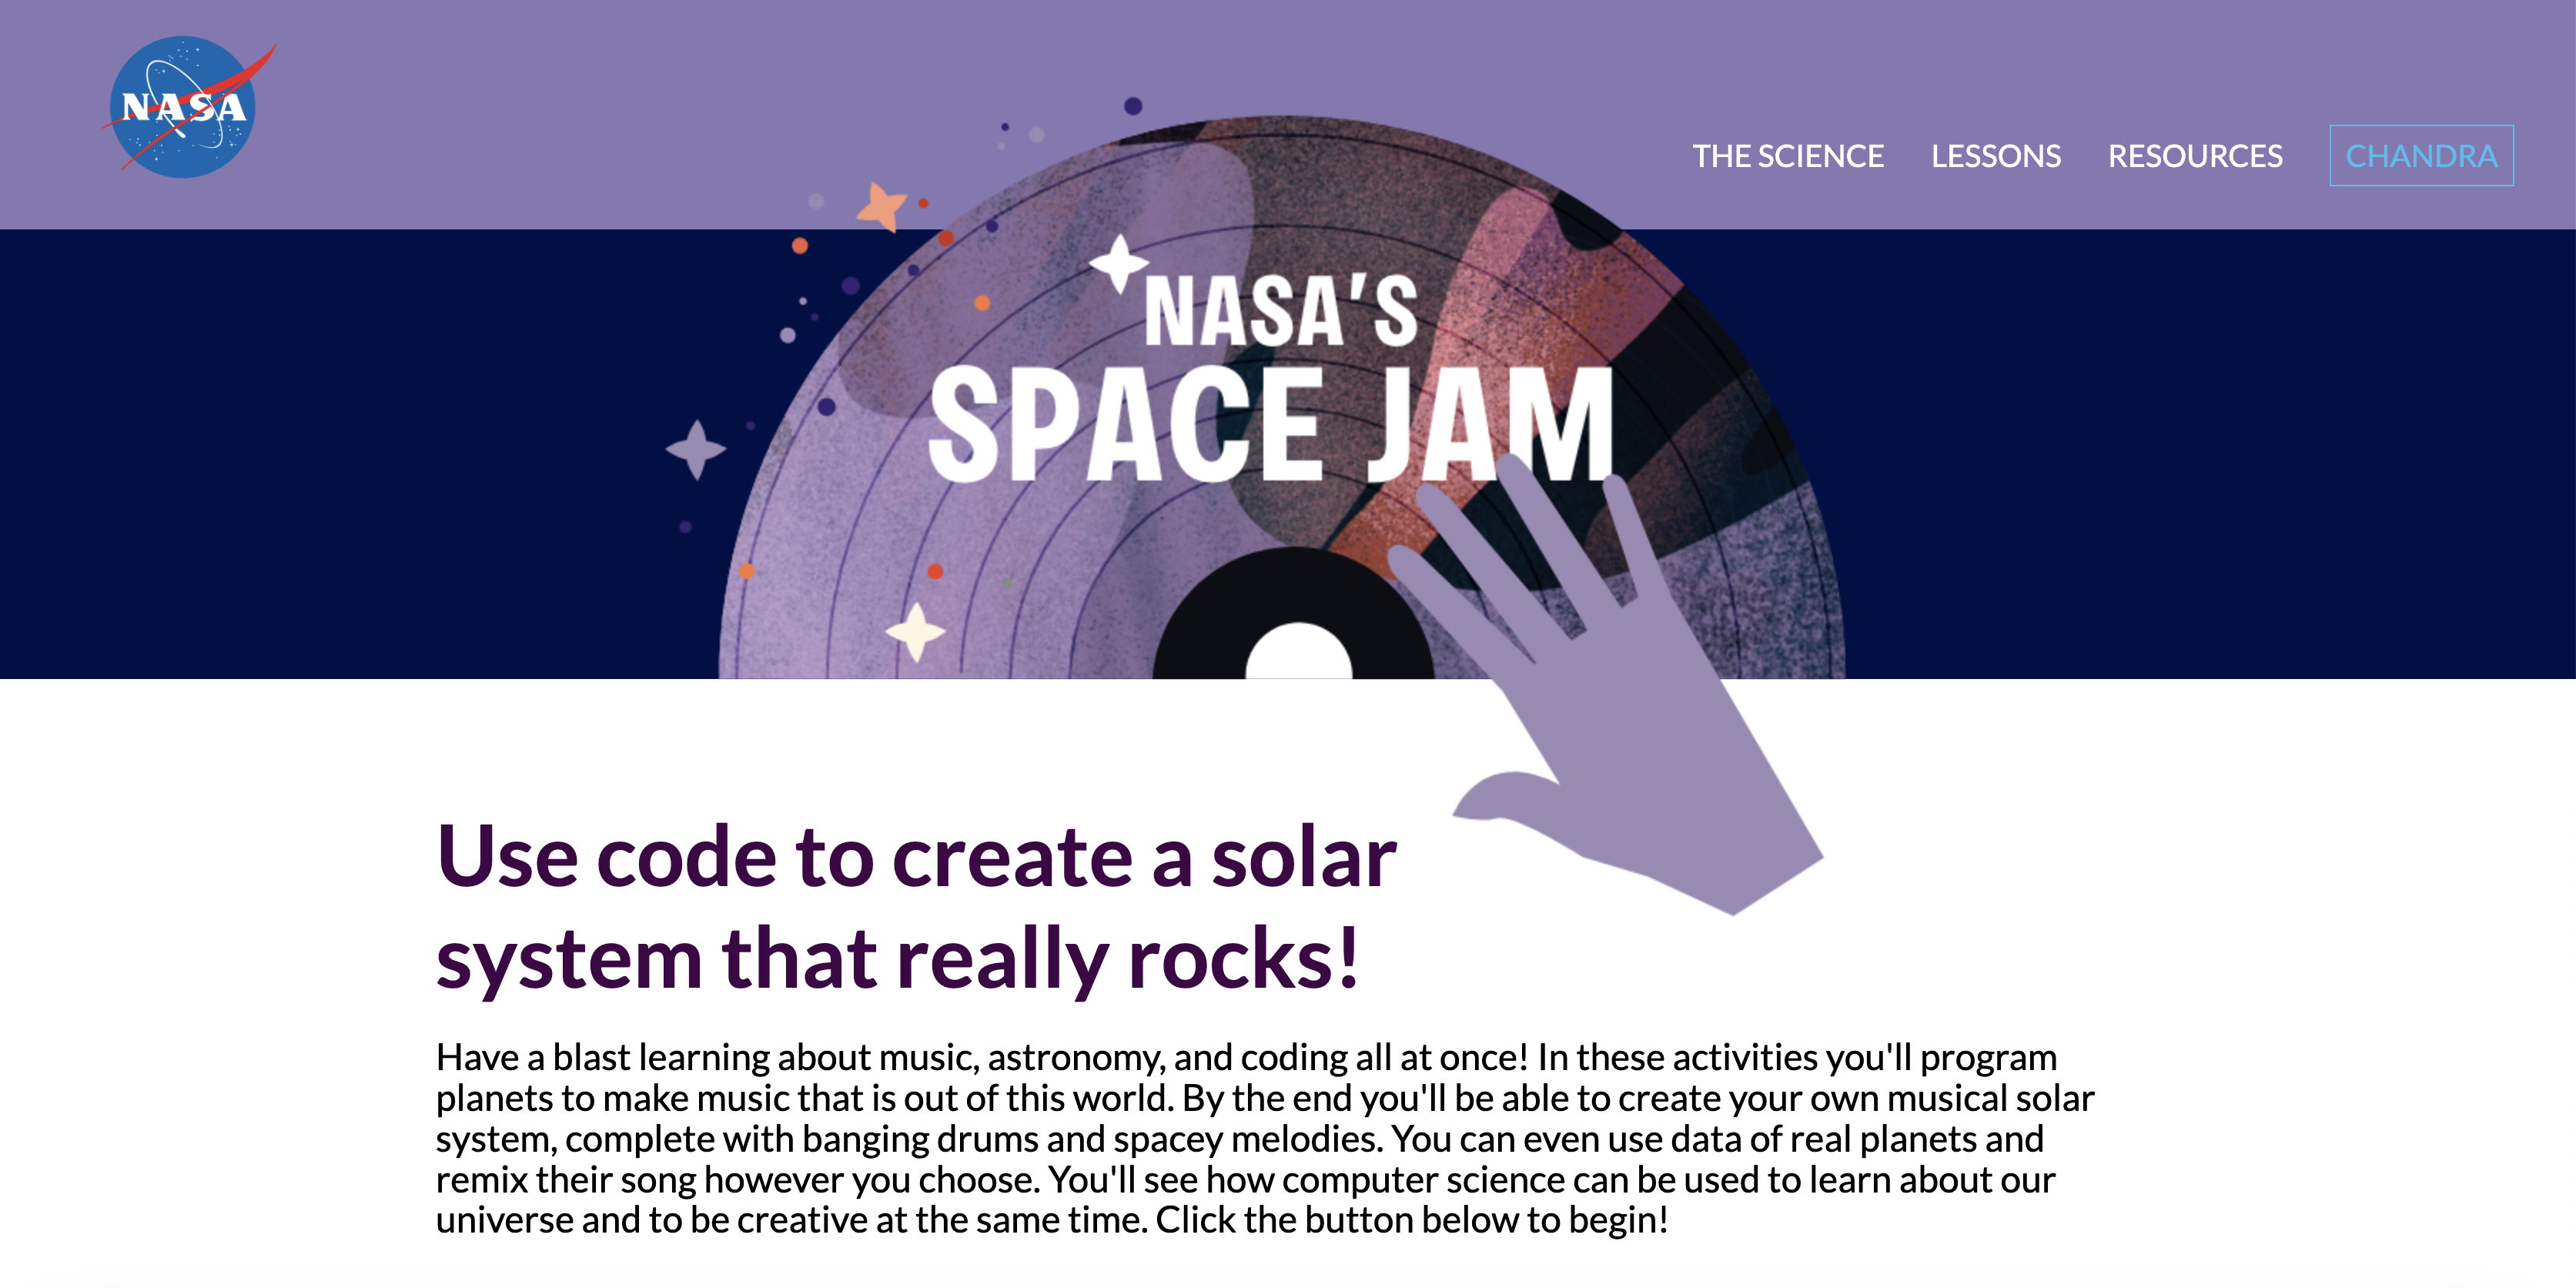
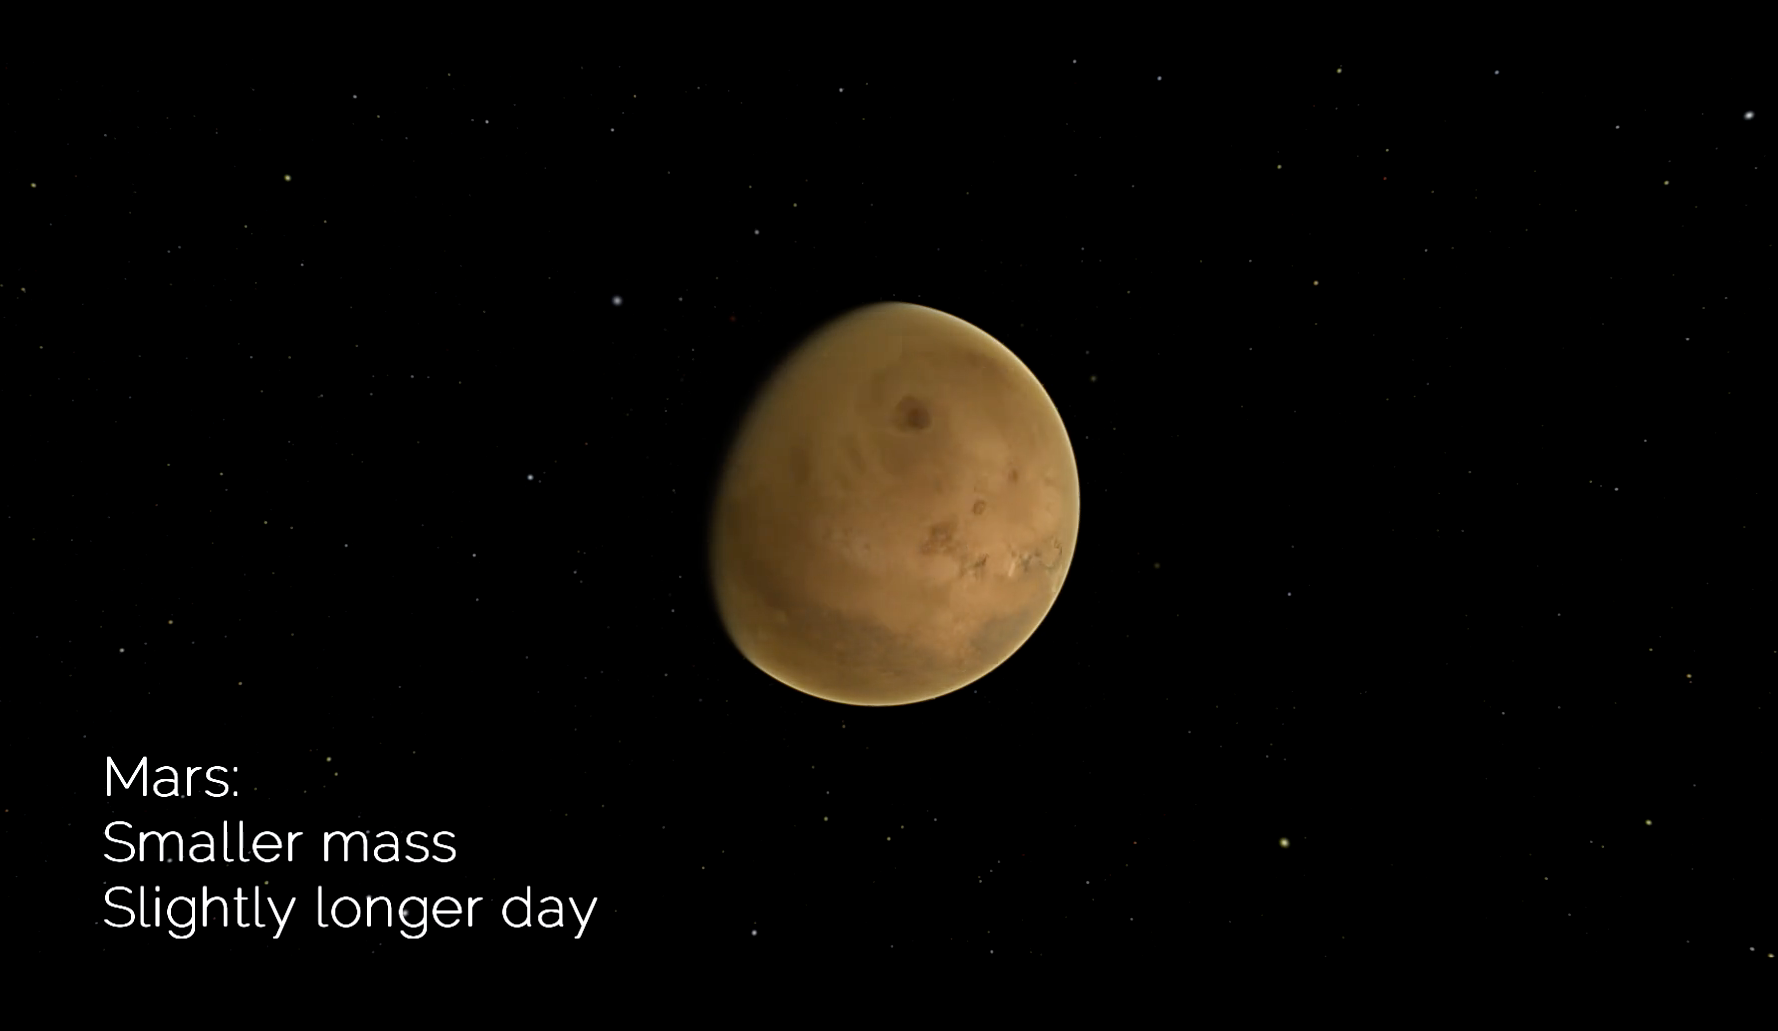
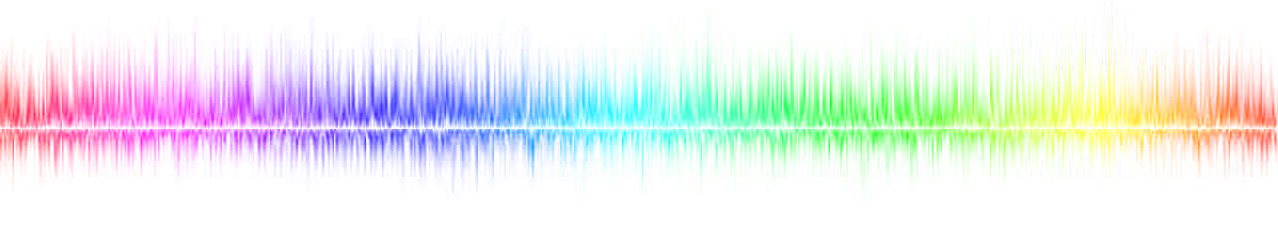
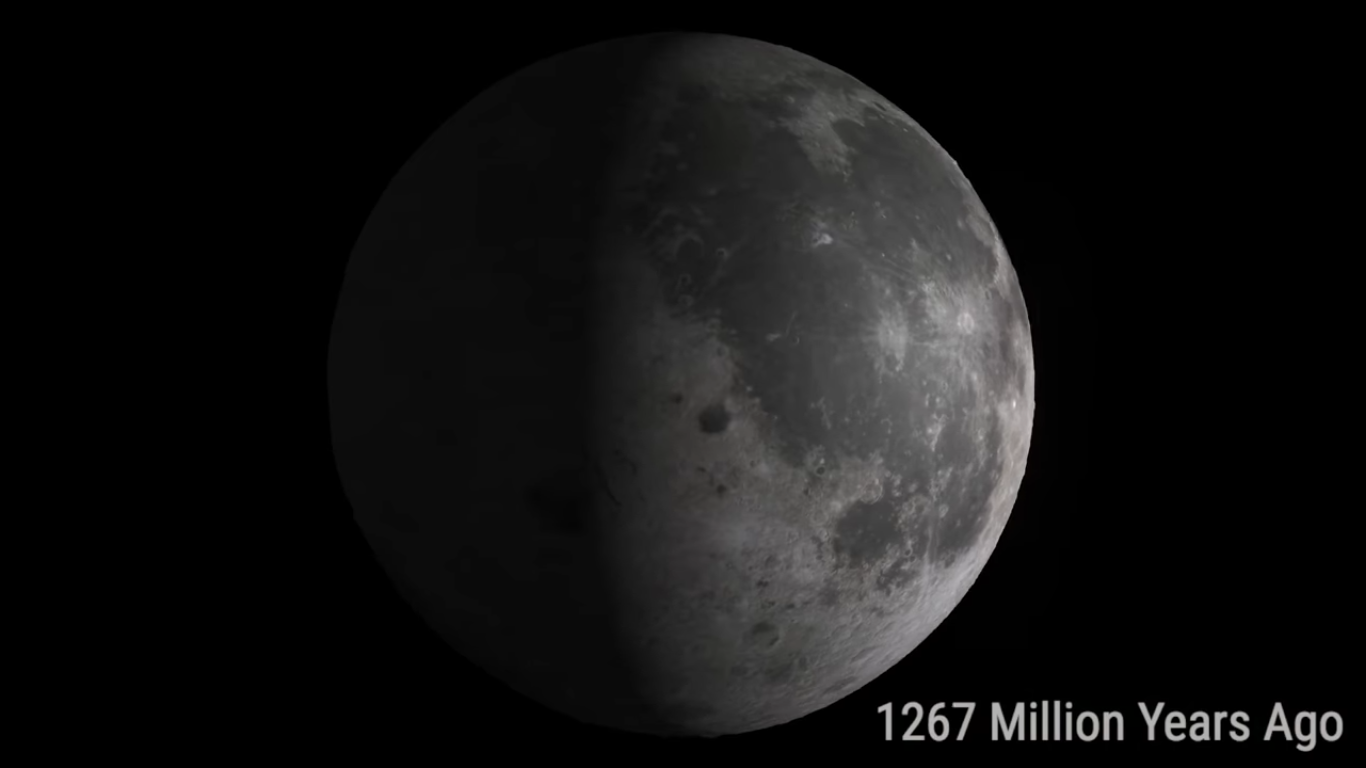
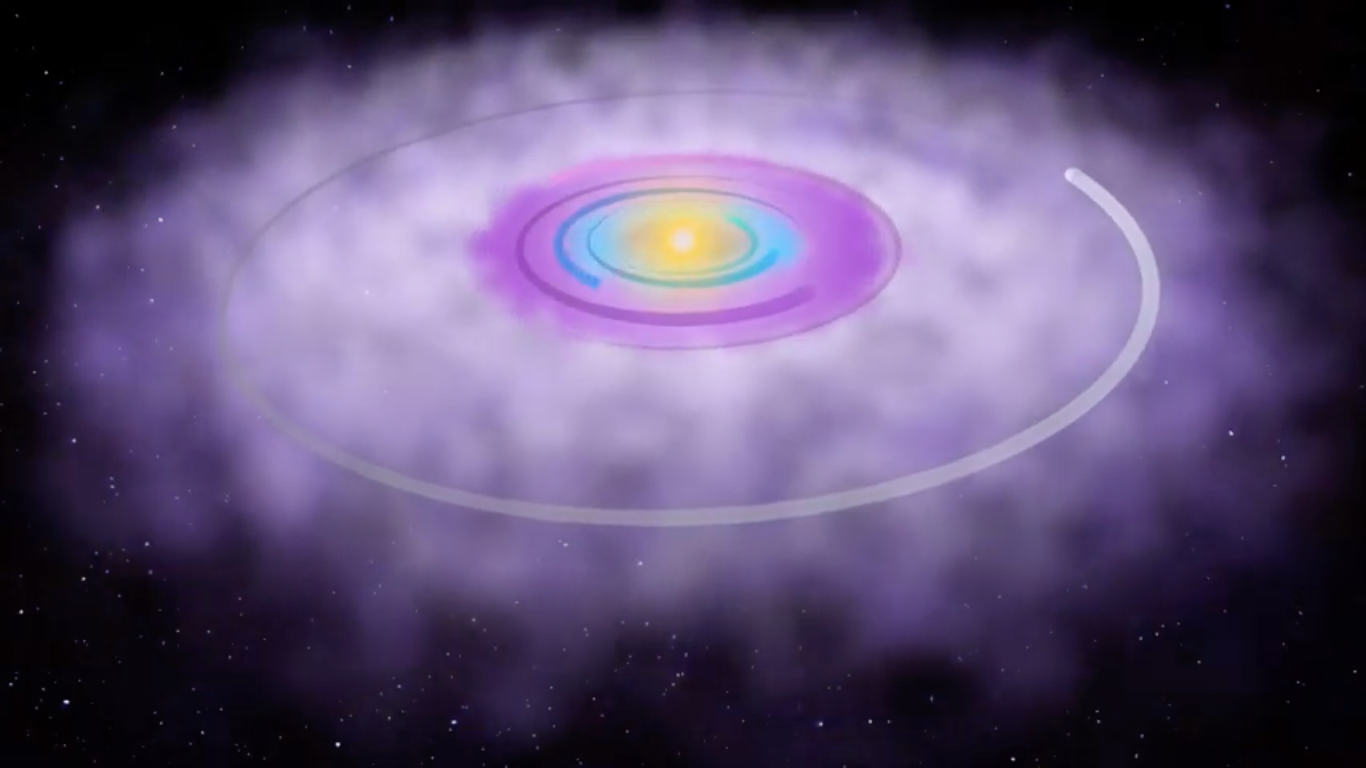
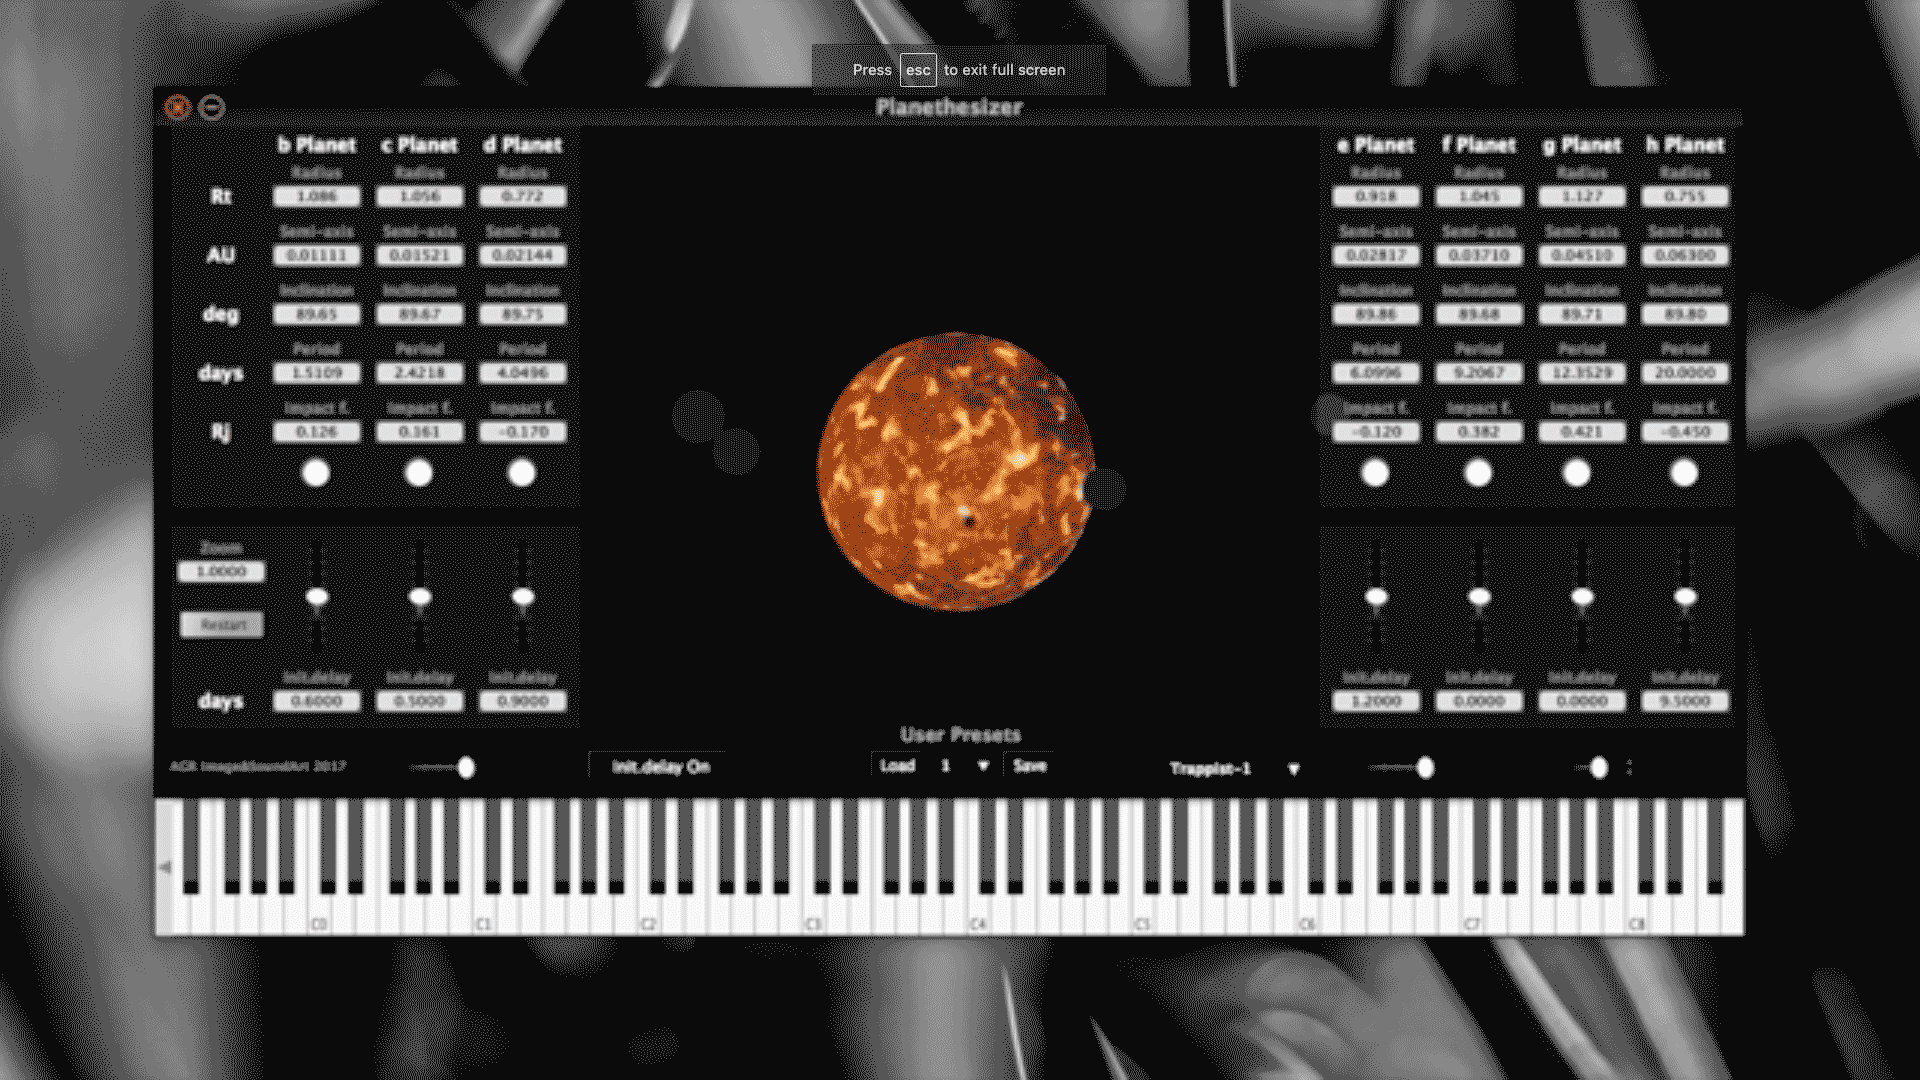
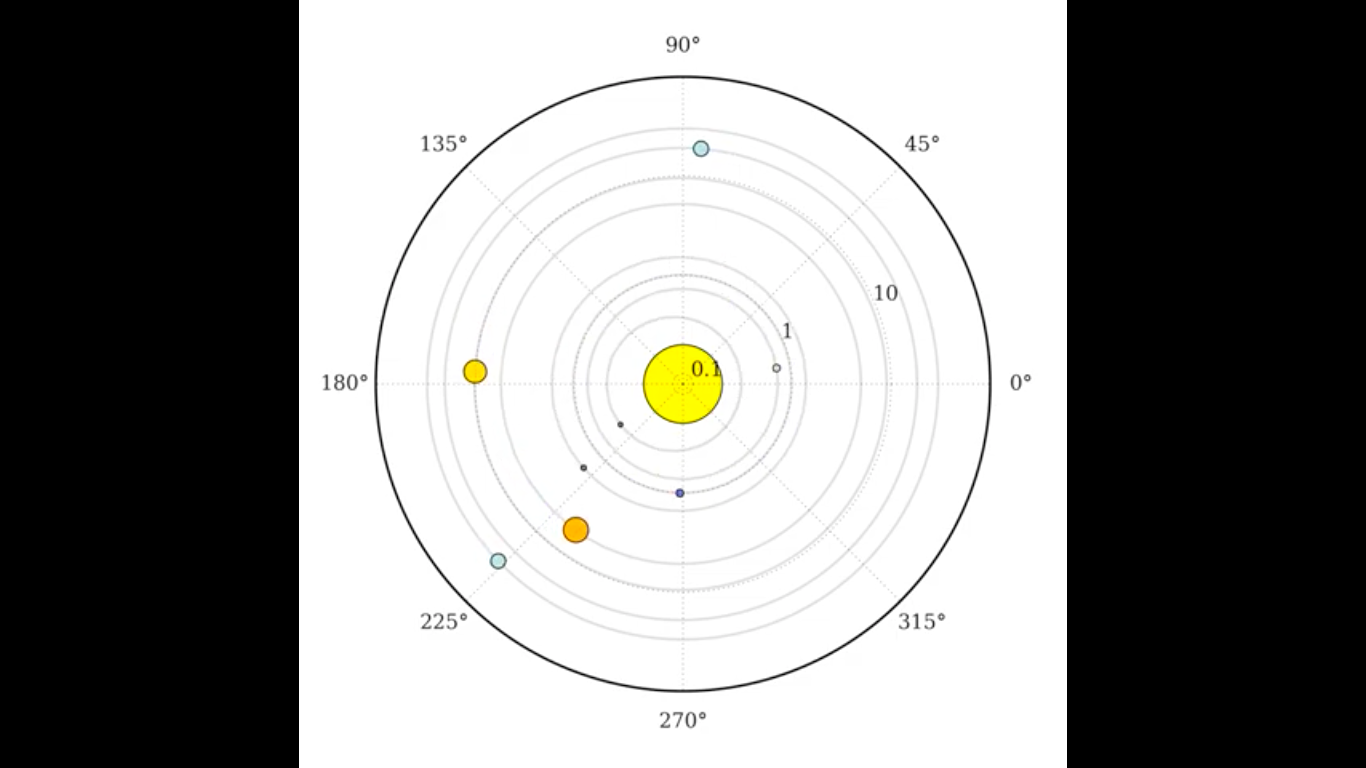
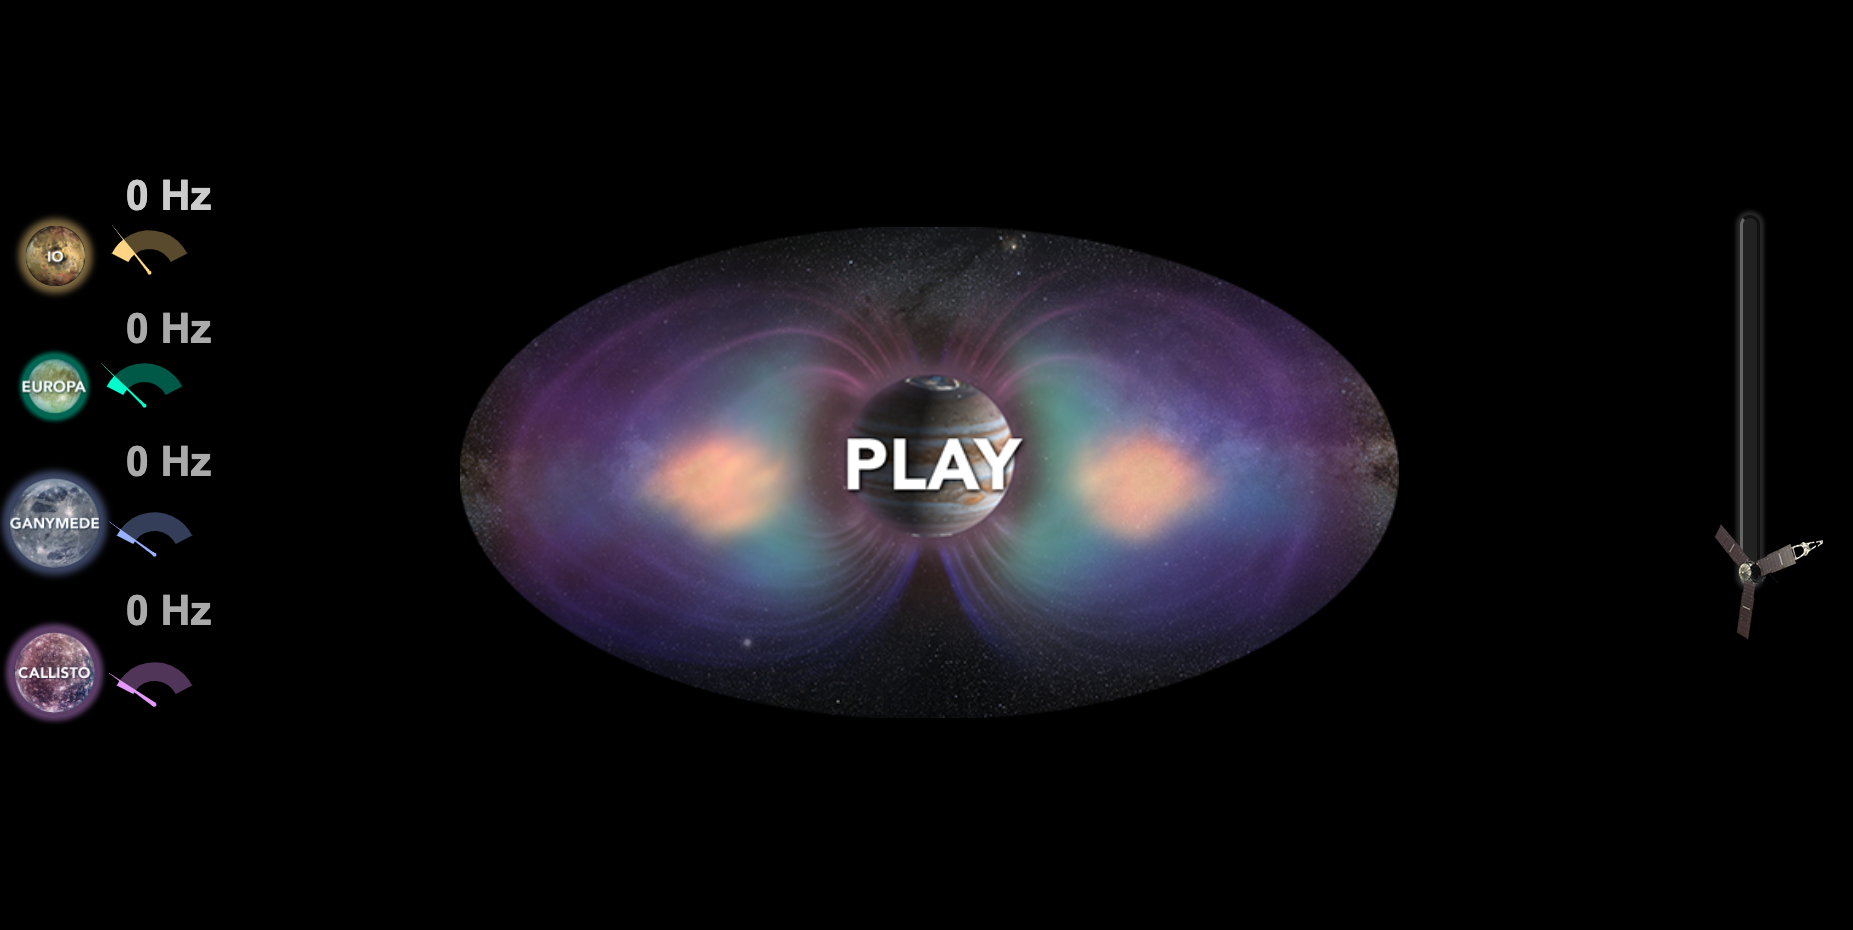
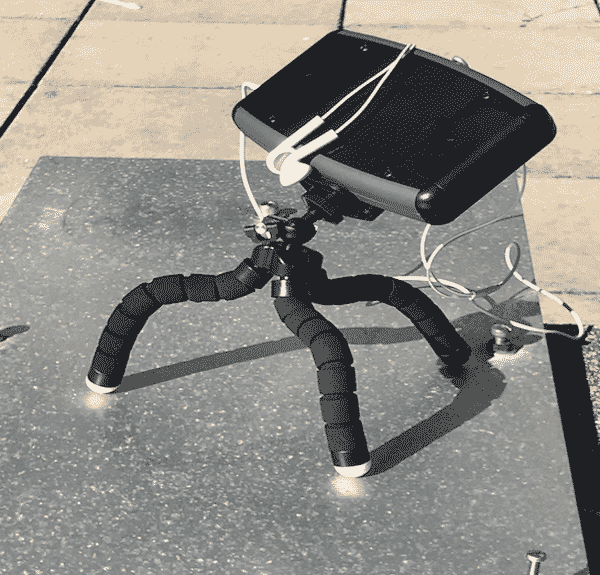
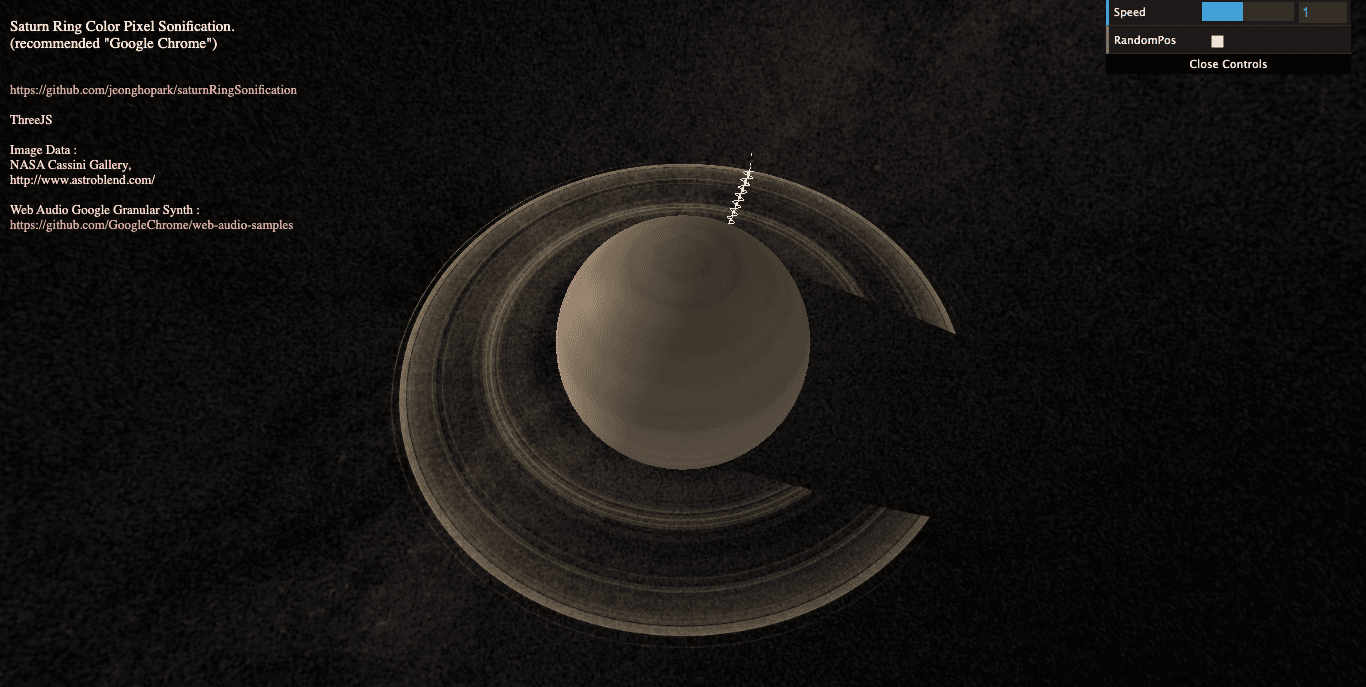
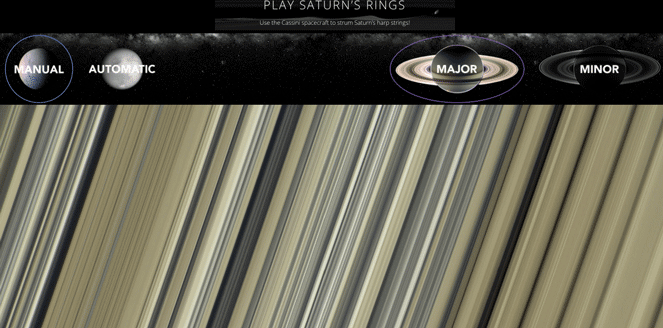
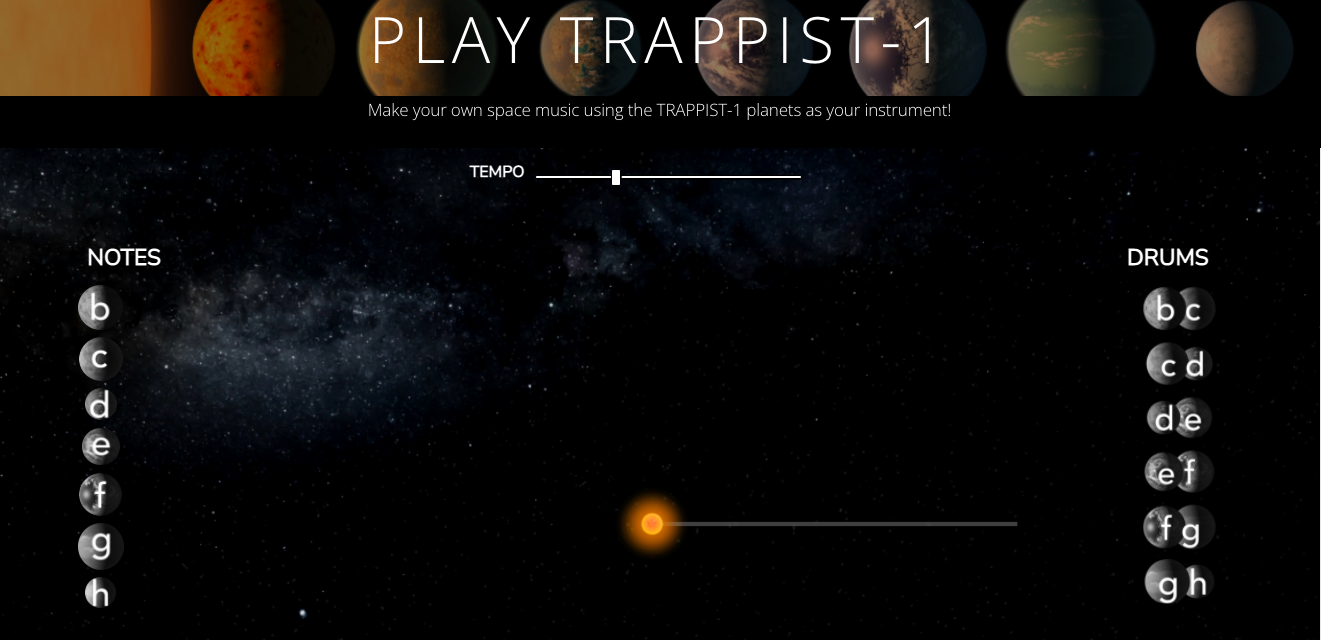
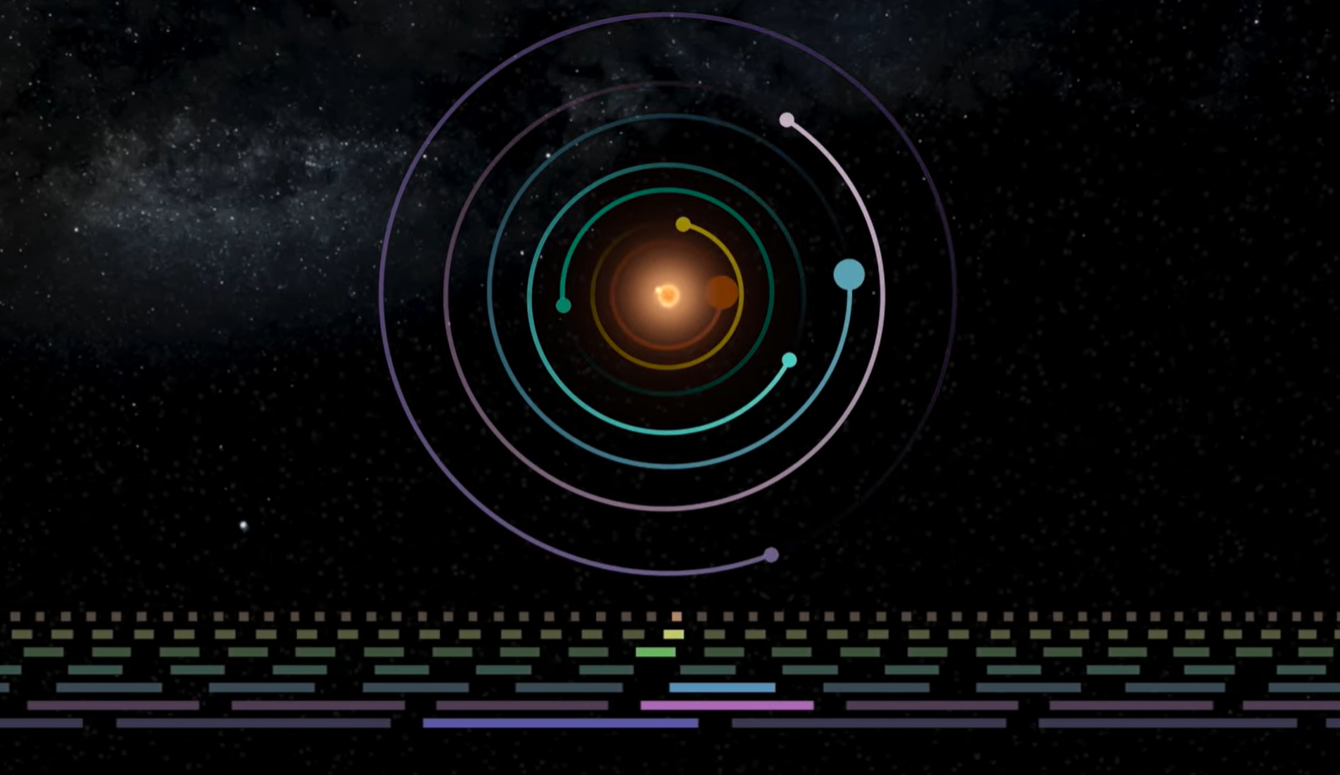
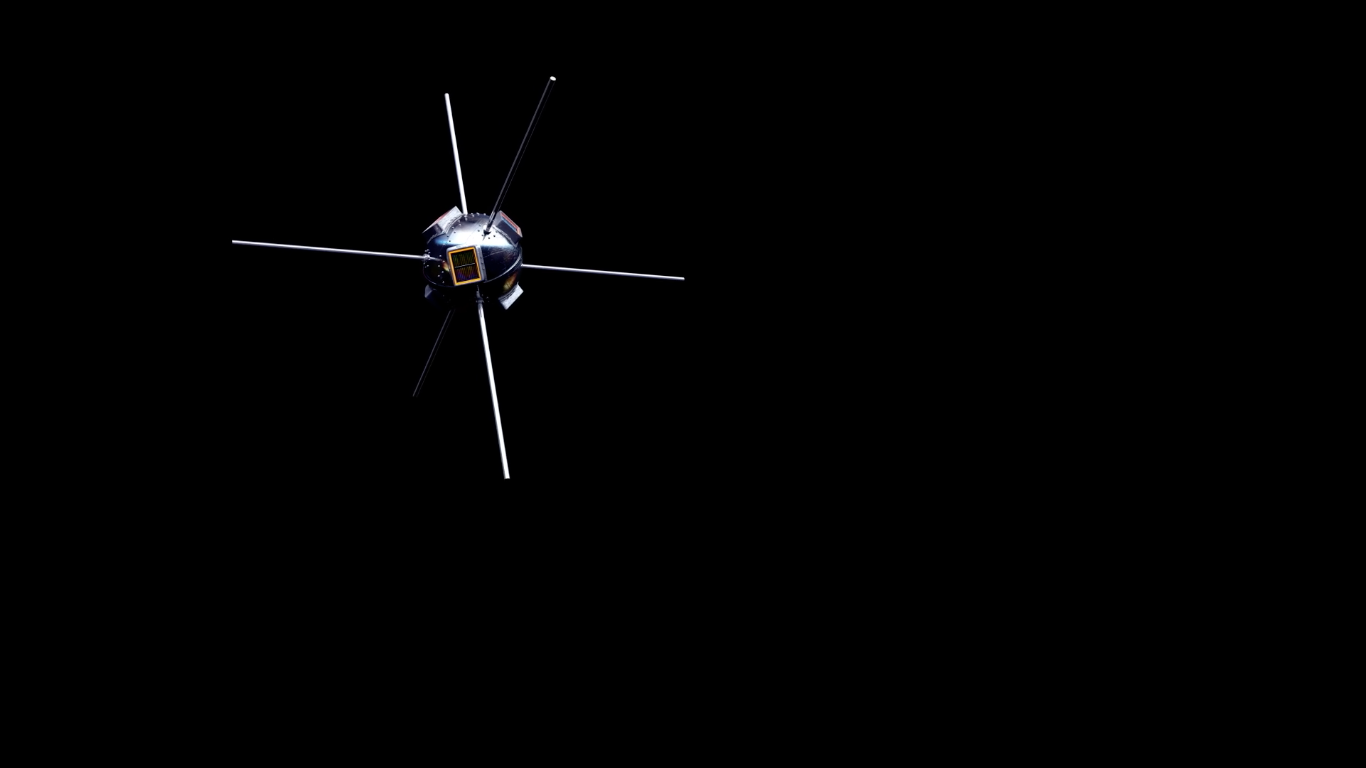
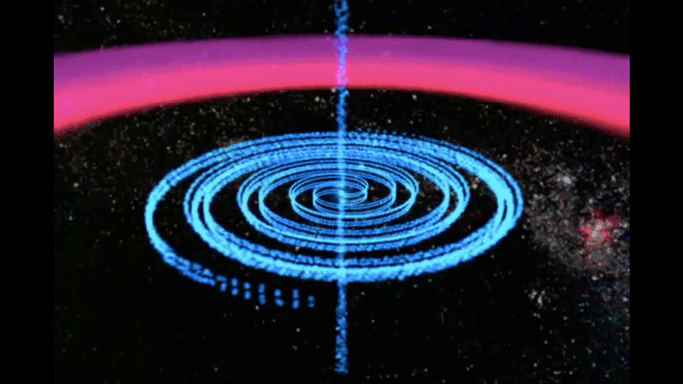
A sonification and visualization of planet orbits in the solar system which can be interacted with. The sonification was made for the purposes of art and education.
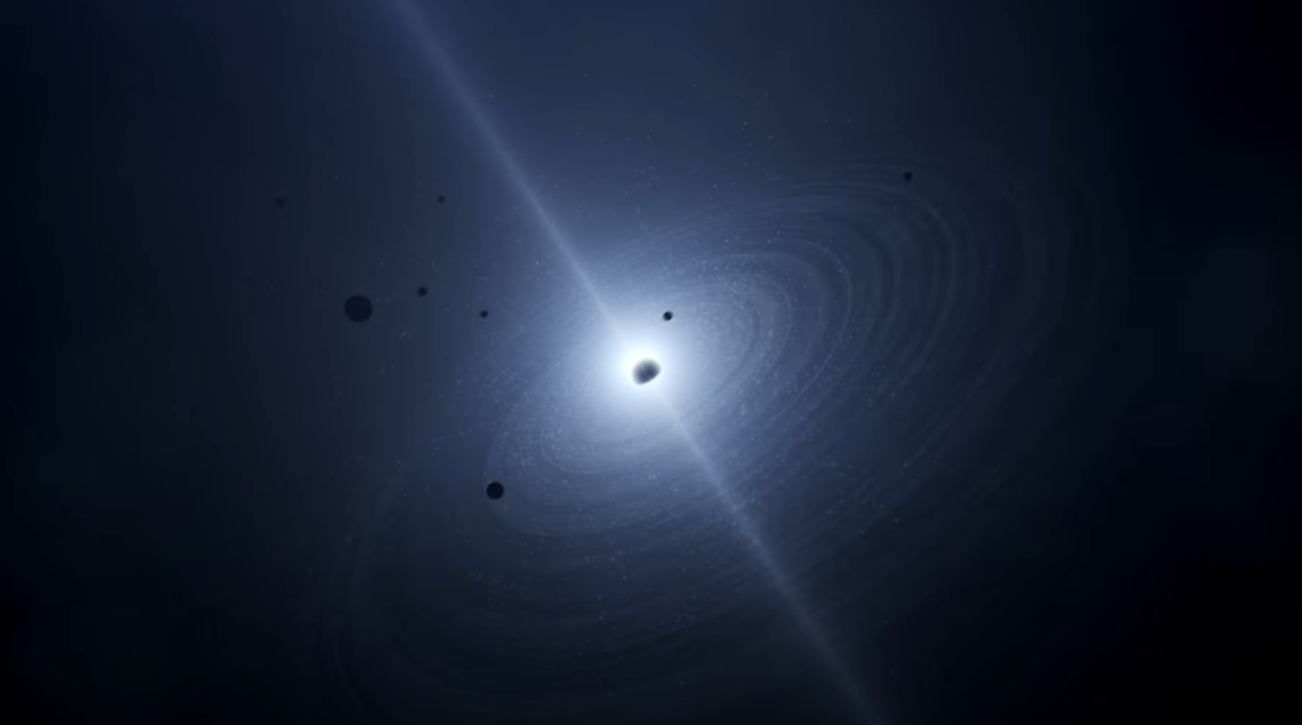
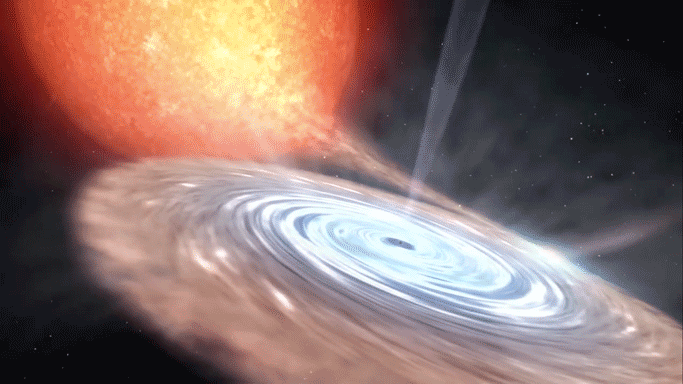
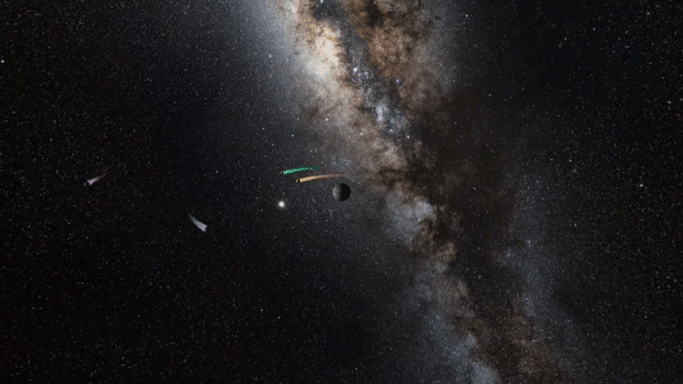
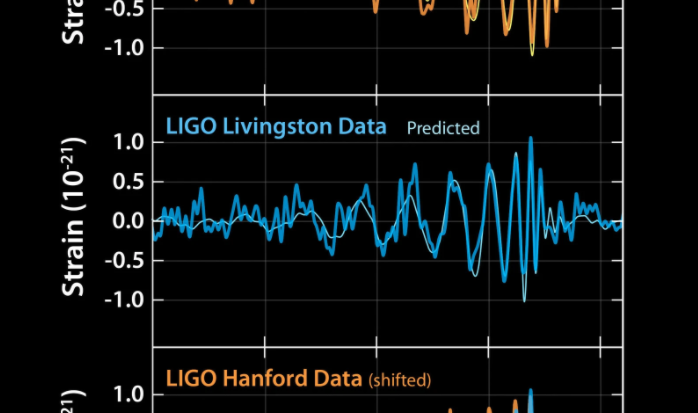
Every confirmed gravitational wave detection to date is sonified with audification. The time between each is compressed so that 4.5 years takes only 1 minute 15 seconds.
The artist gave us permission to use the illustration here:
https://www.ligo.caltech.edu/page/press-release-gw170104
in case you'd like to use it as the thumbnail. Thanks!
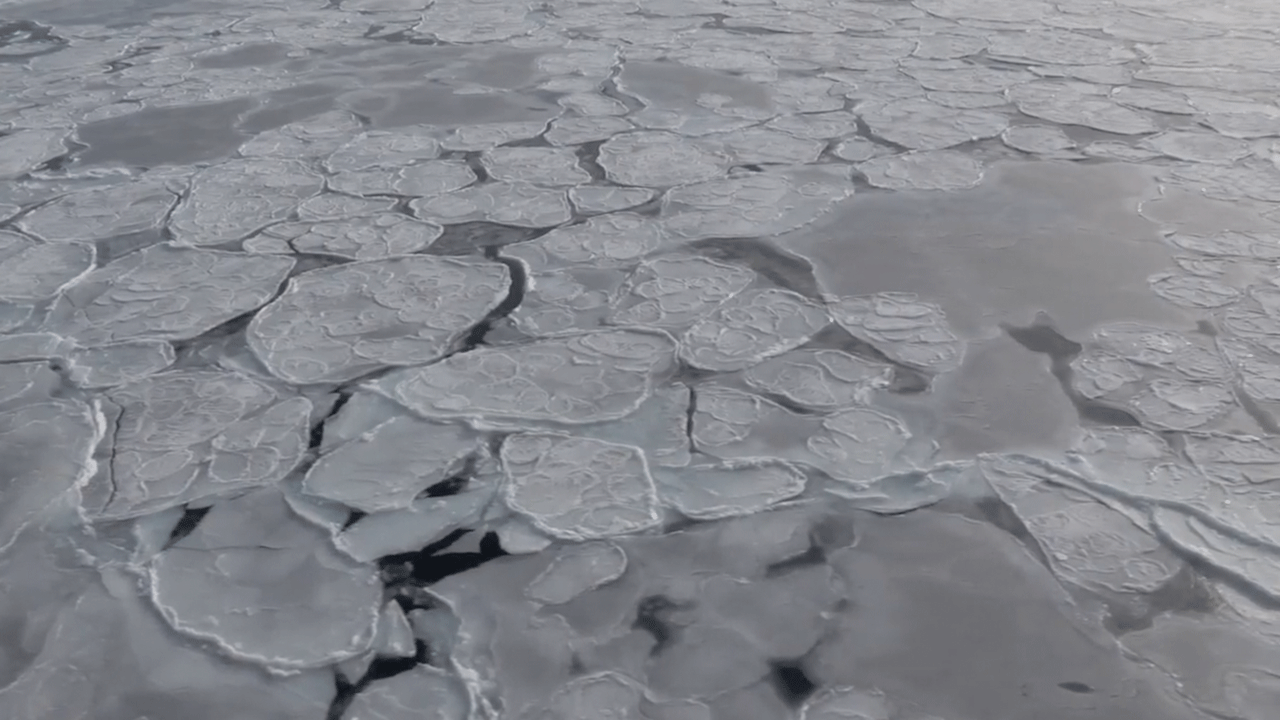
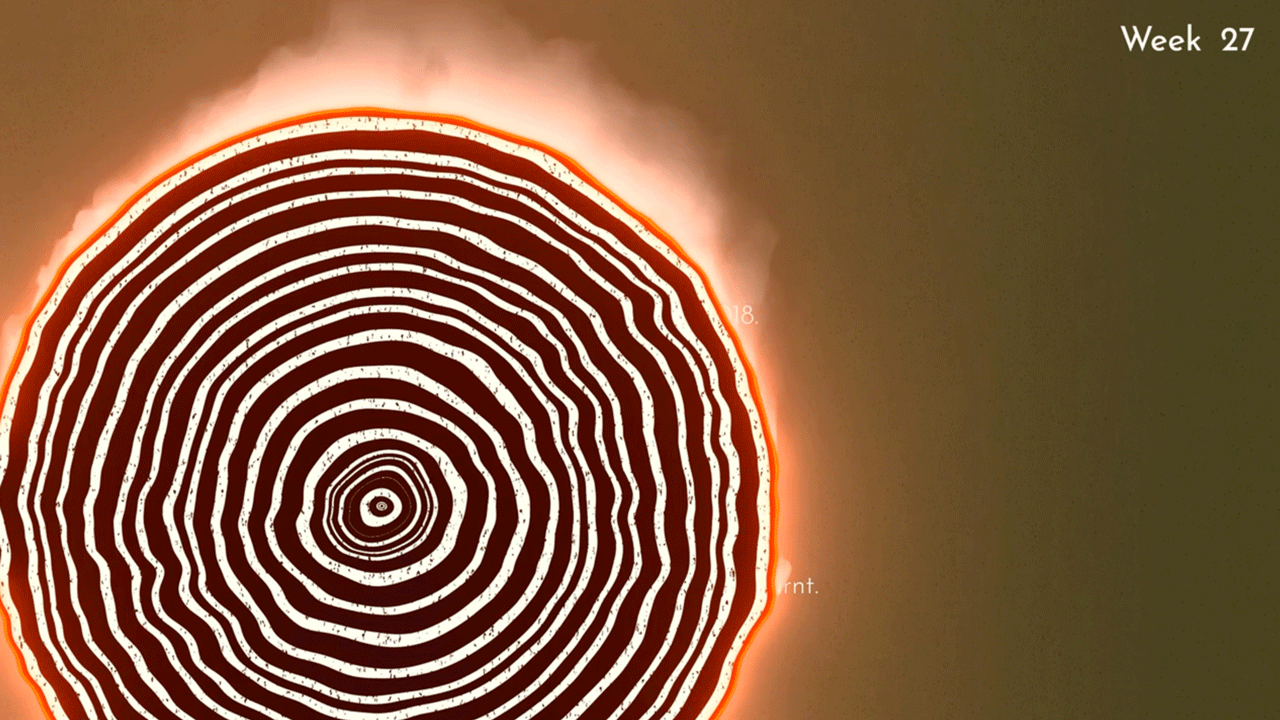
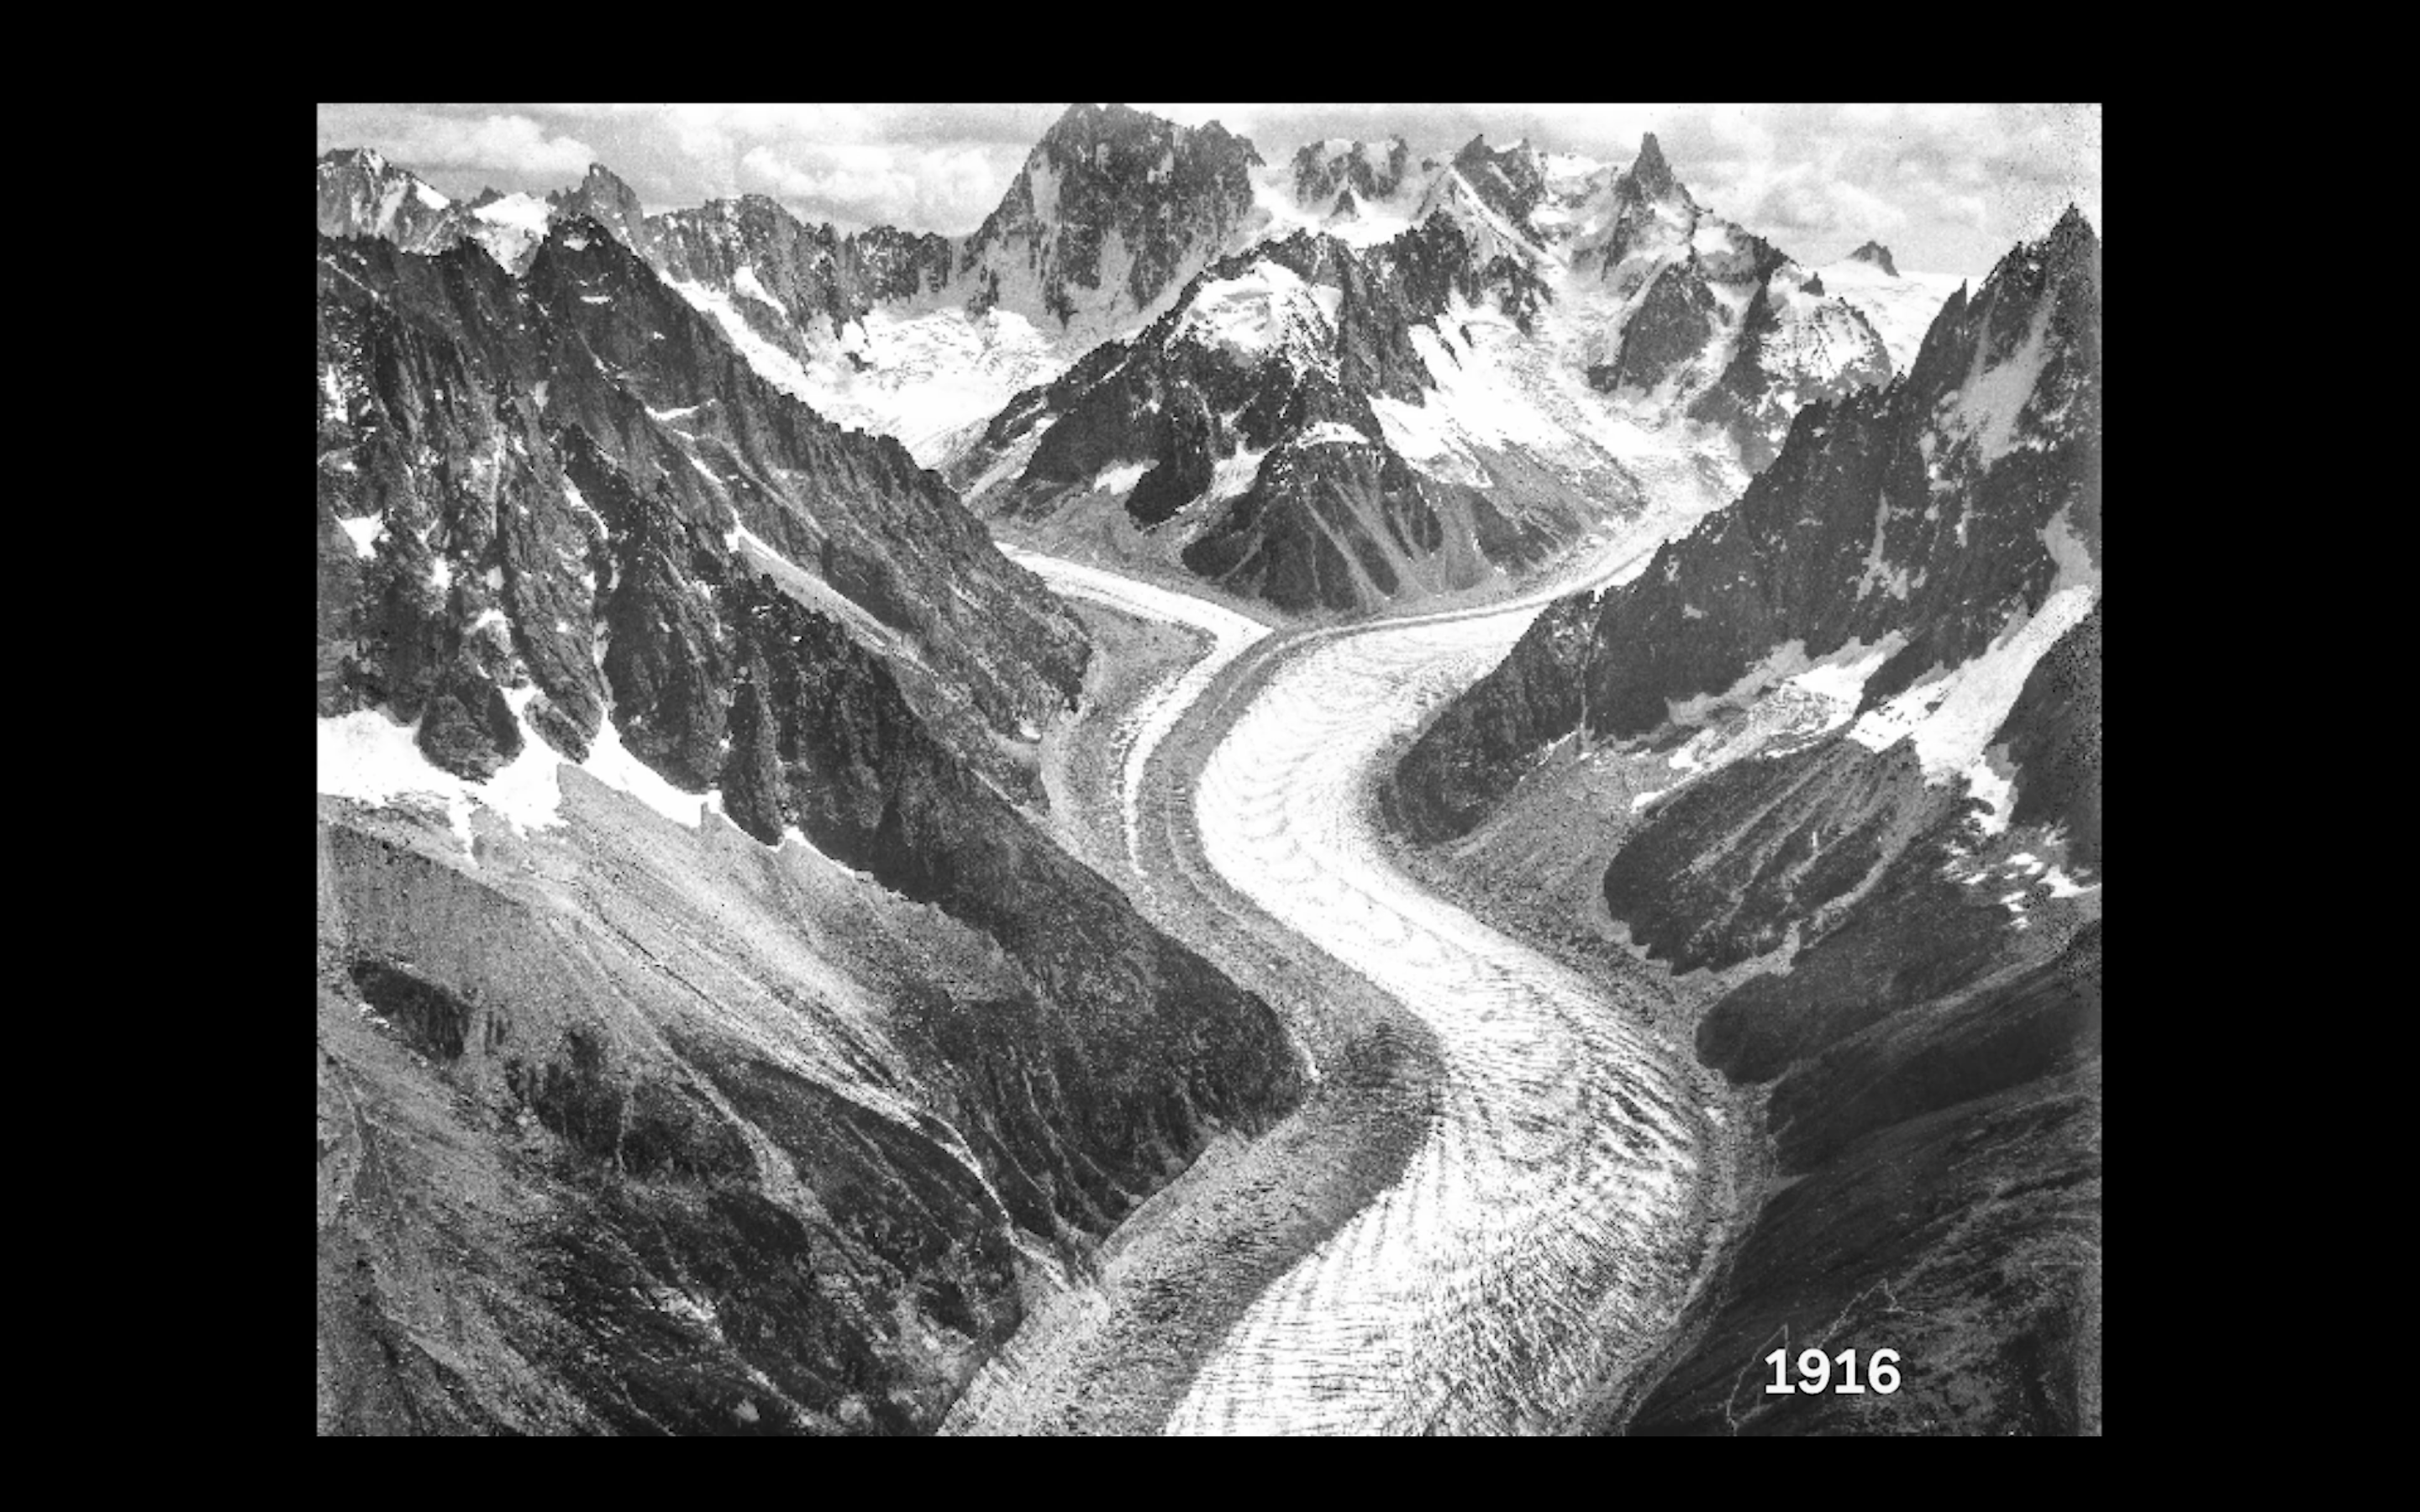
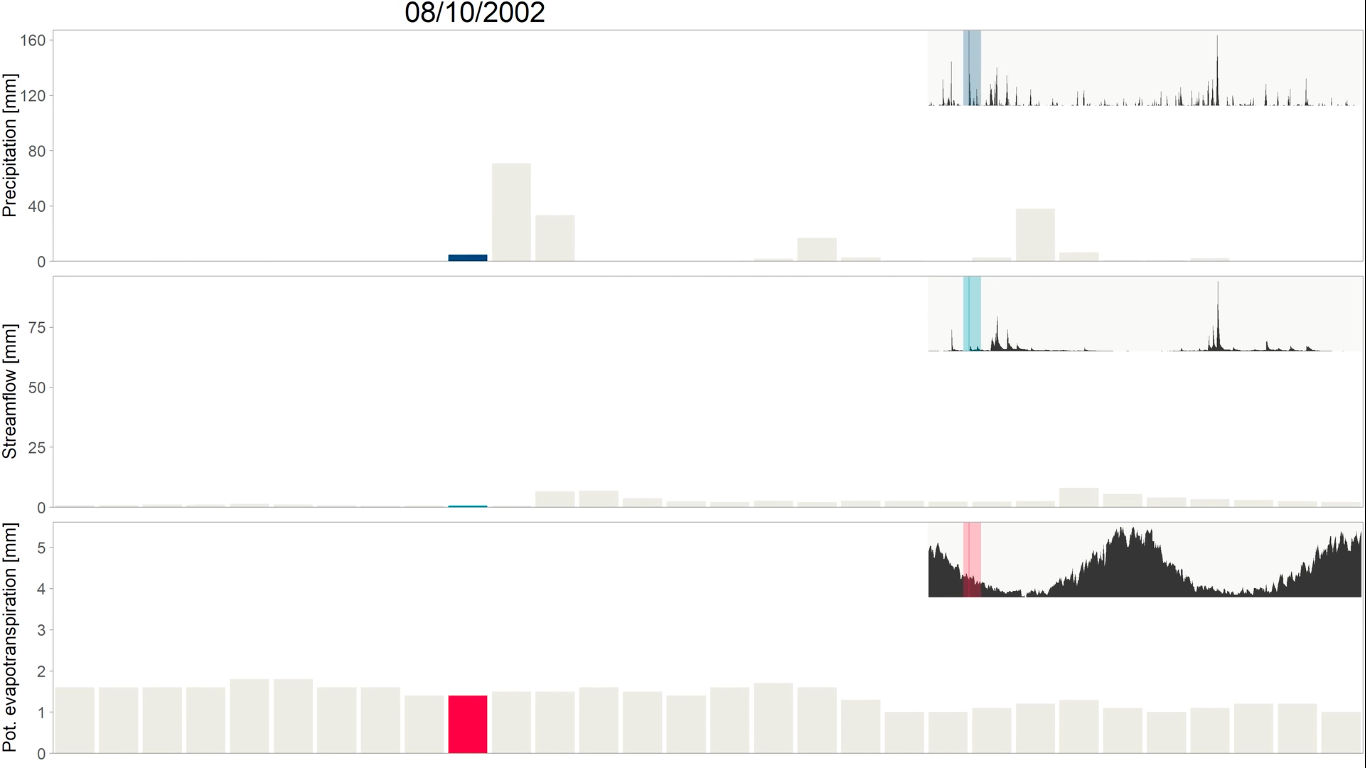
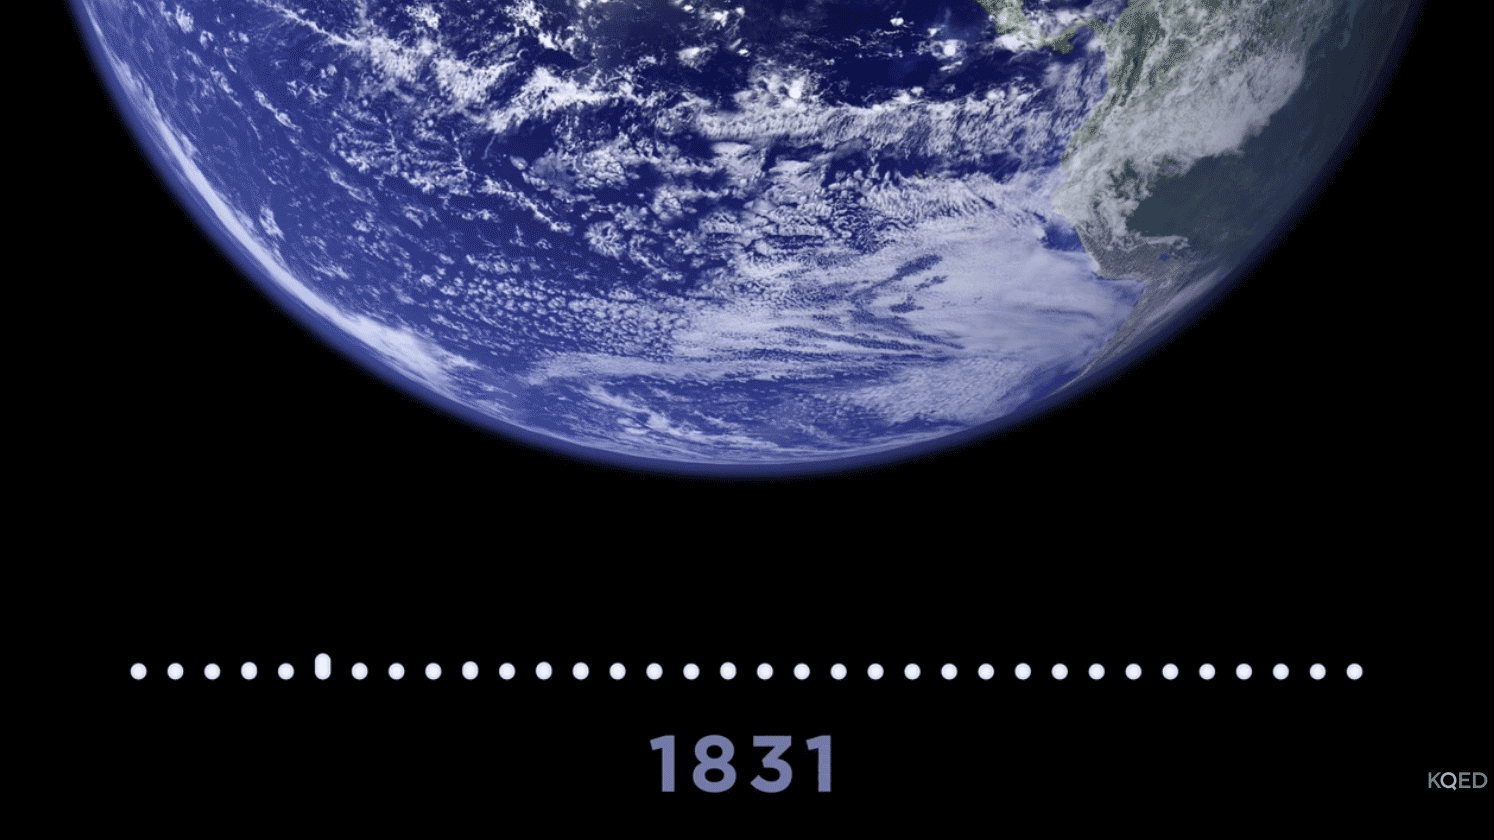
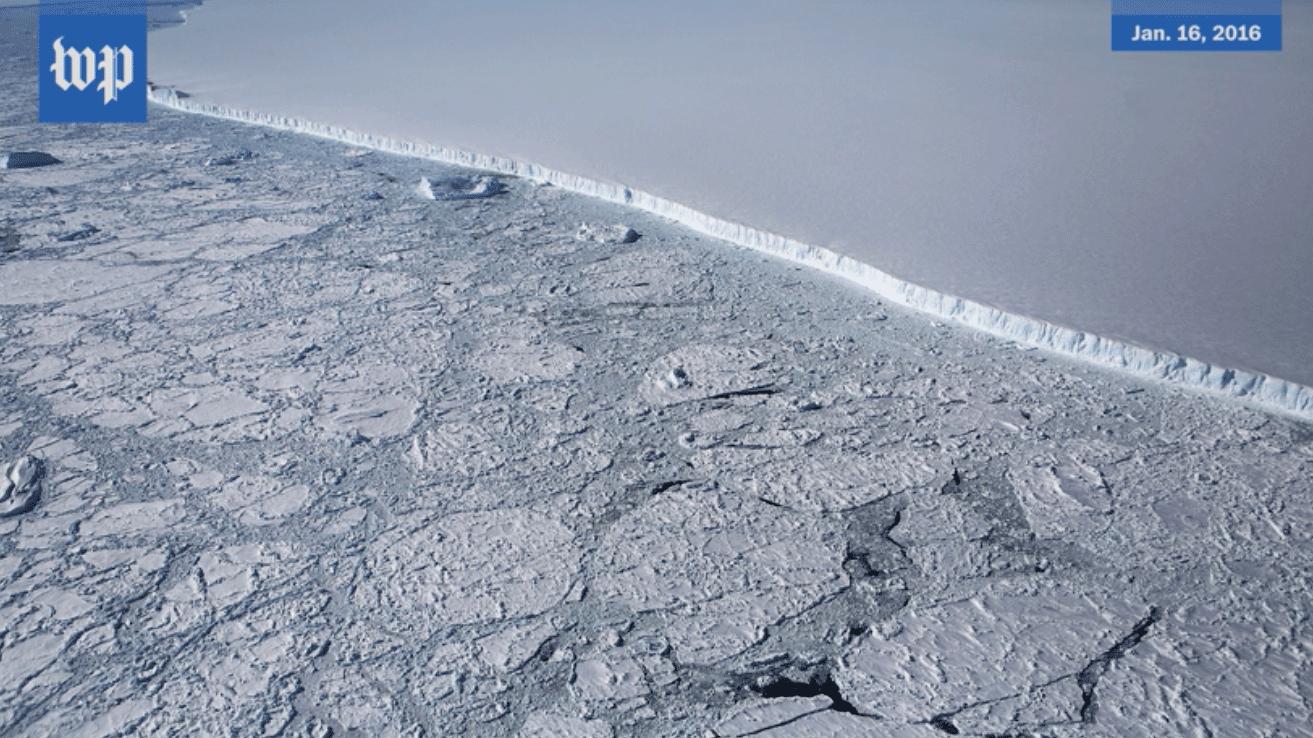
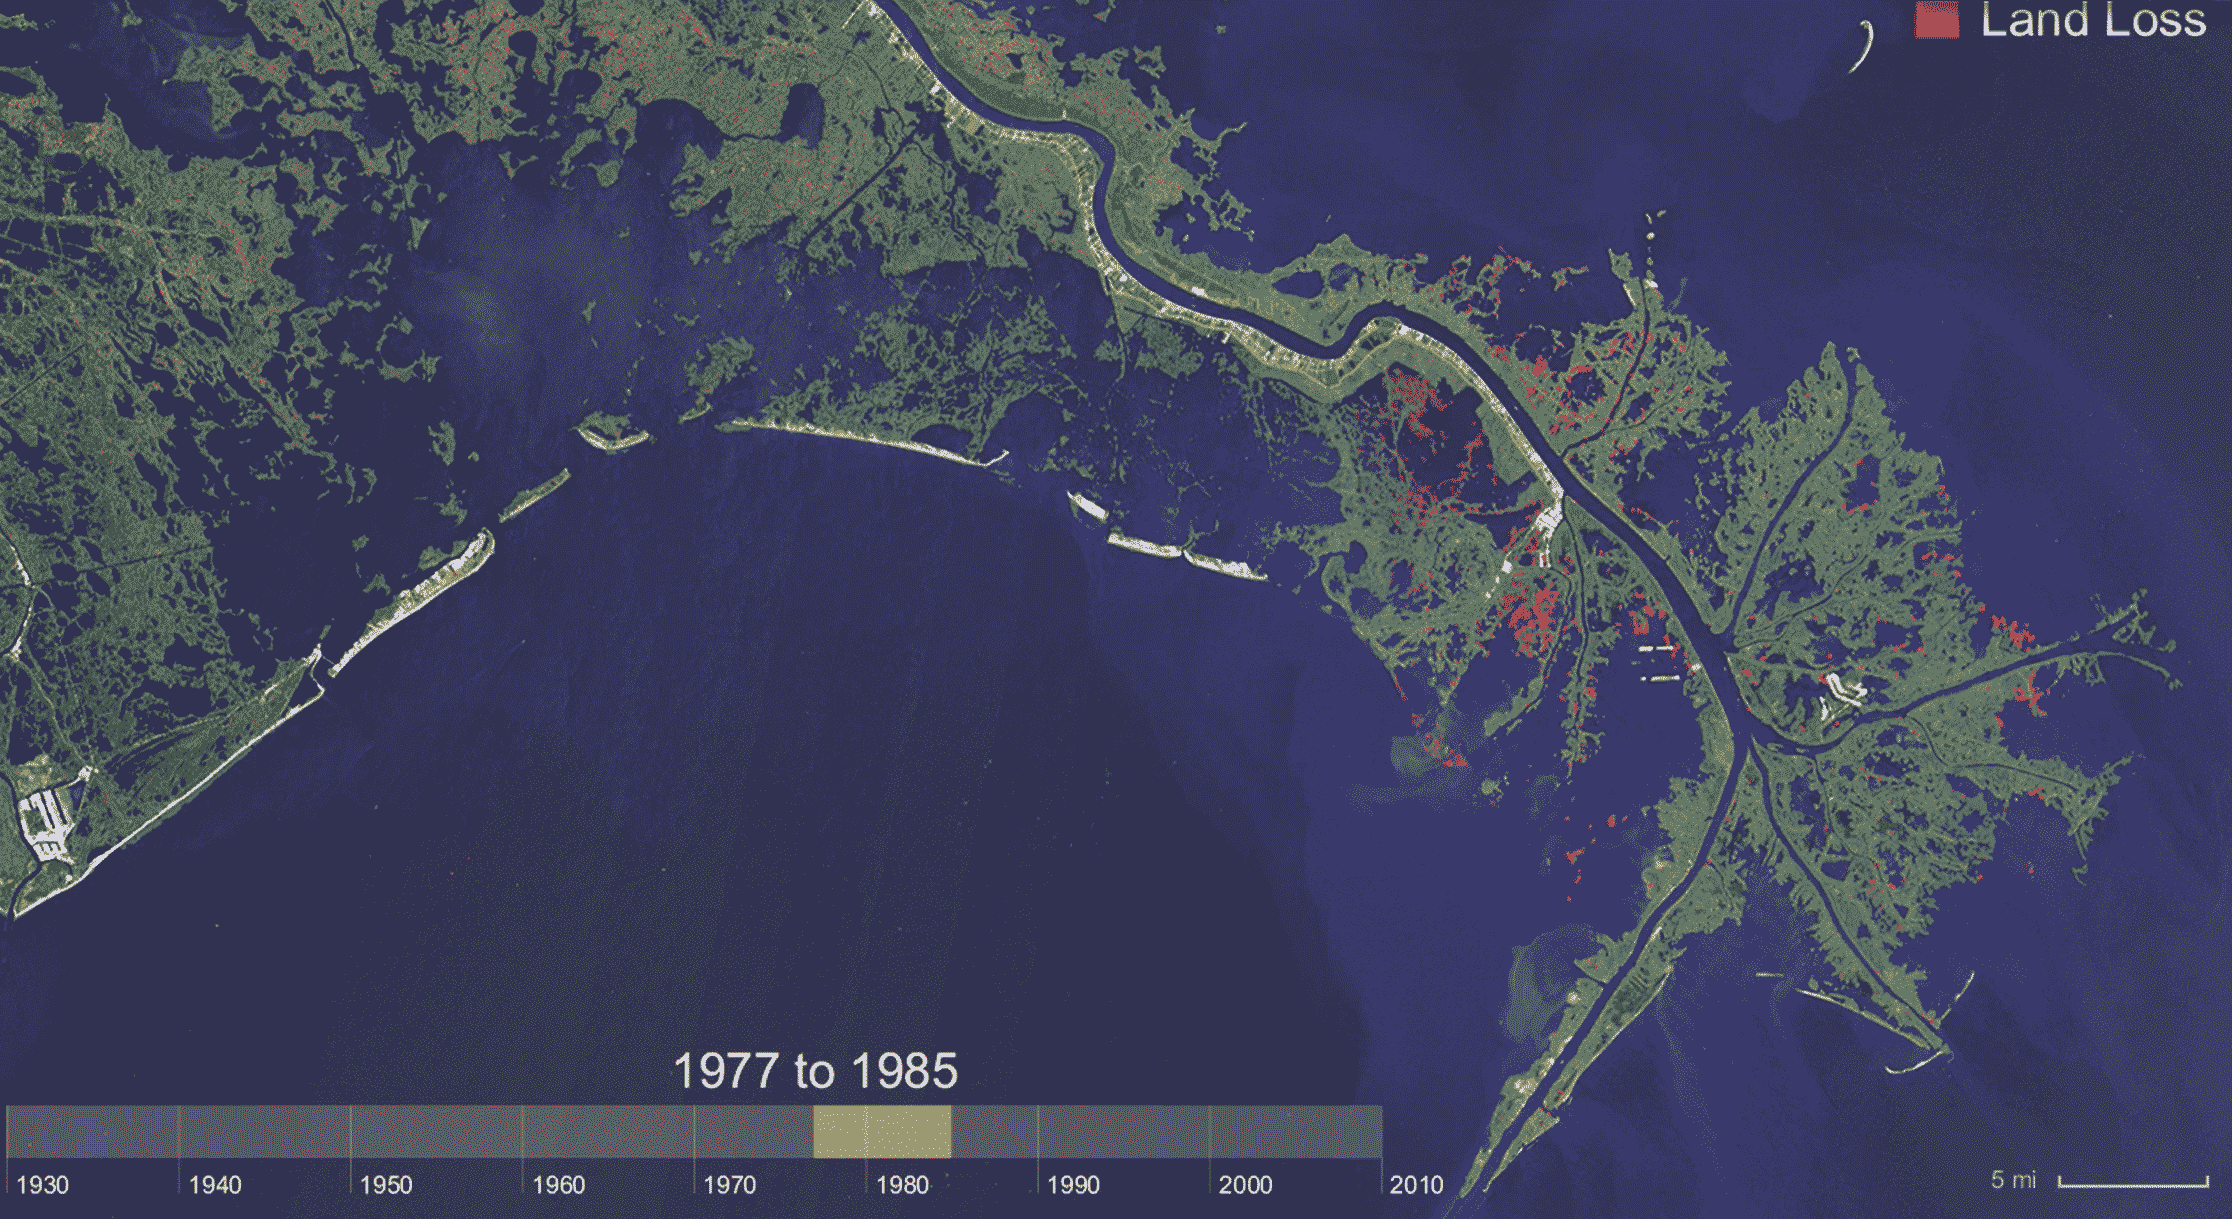
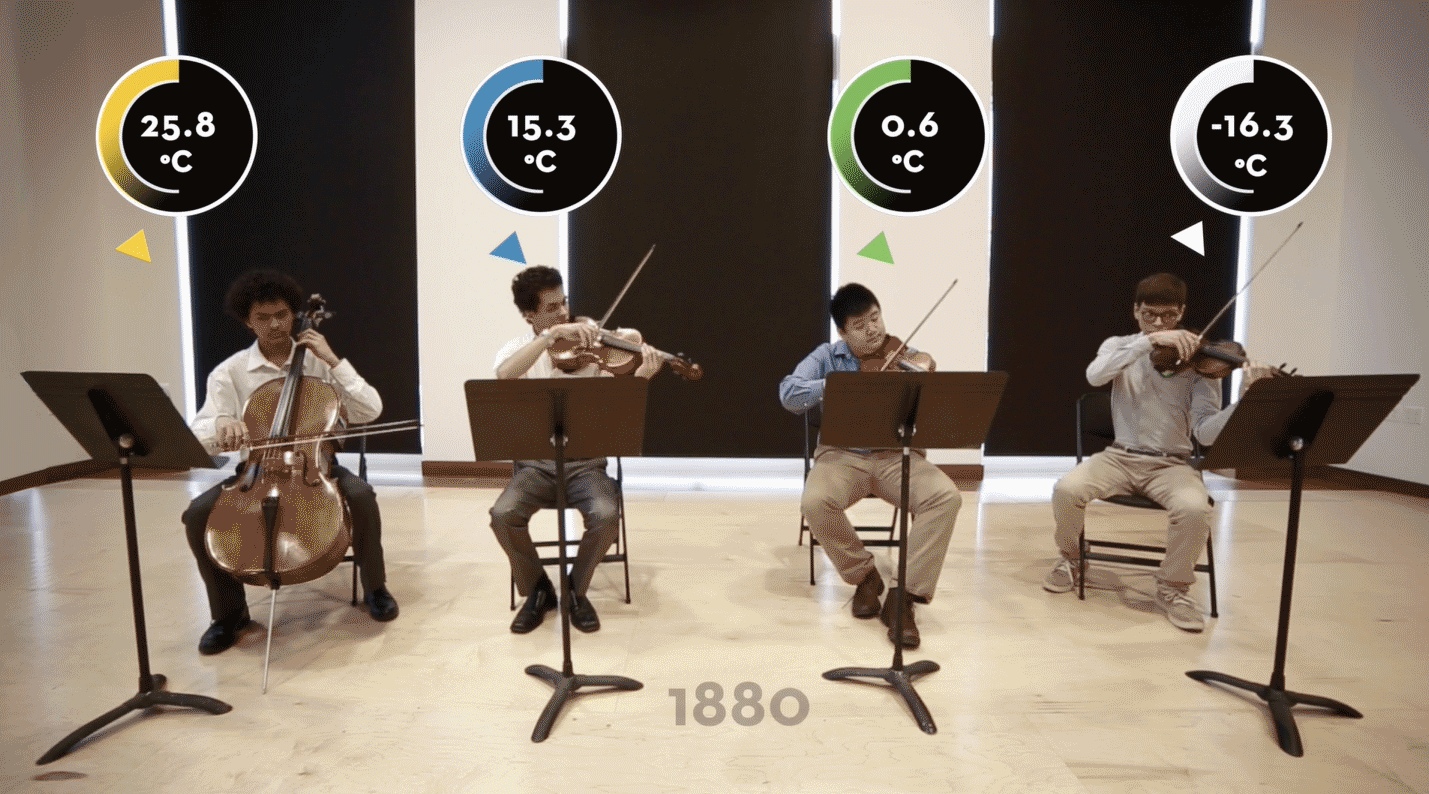
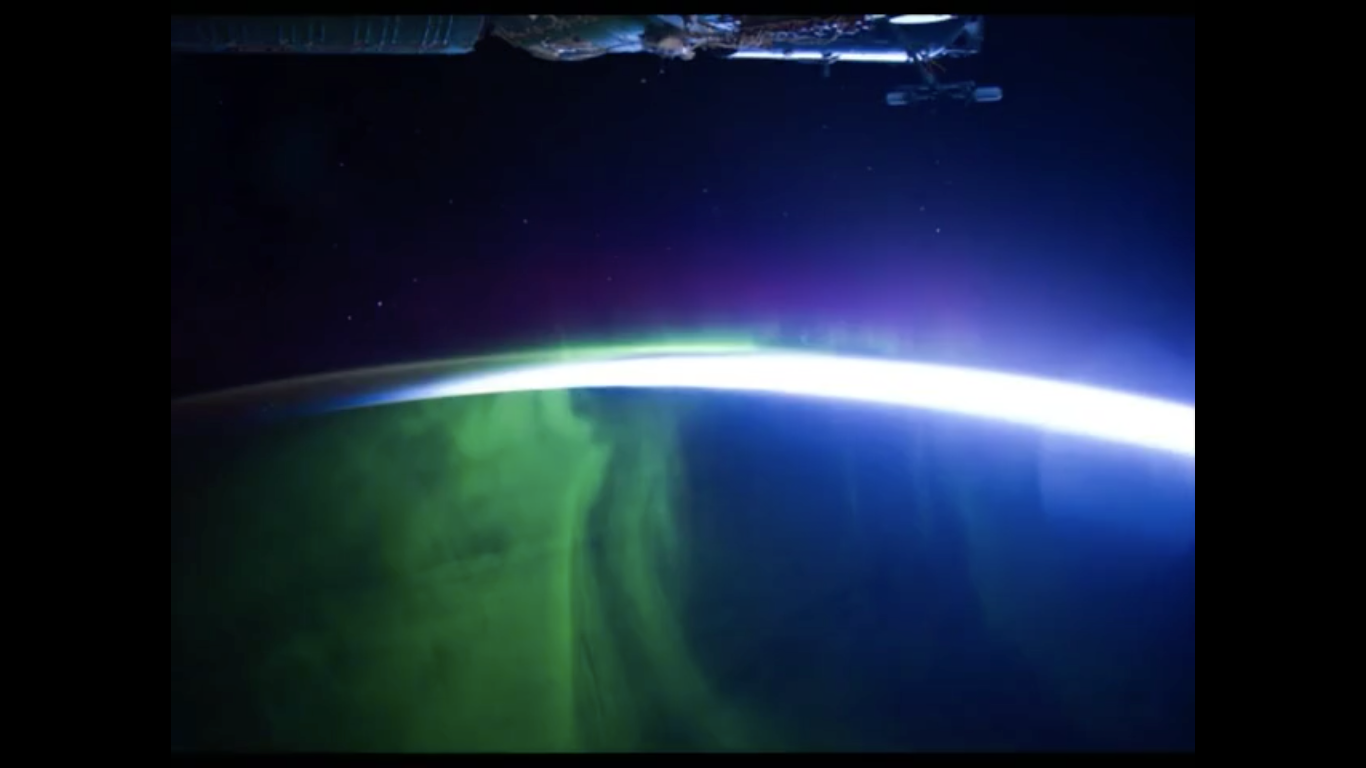
The Mer de Glace (‘Sea of Ice’) is an valley glacier located on the northern slopes of the Mont-Blanc massif in the French Alps. It can be regarded as the longest and largest glacier in France. The evolution of glaciers is one of the important indicators for situating climate variability and trends over the last century.
Data (from 1907 to 2020): mass balance, retreat of the front, altitude profiles (U, Trelaporte, Echelets, Montenvers and Mottets.) Issued from GLACIOCLIM (the GLACIers, a CLIMat Observatory), a national service of observation aimed at ensuring long-term monitoring of the glaciers of the Alps, the Andes and the Antarctic.
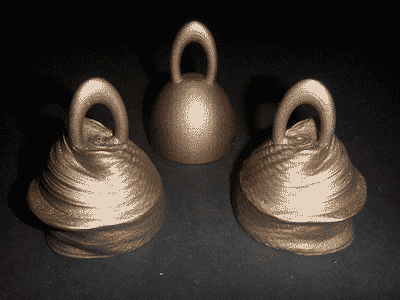
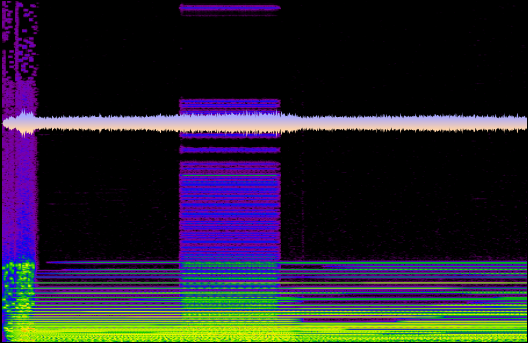
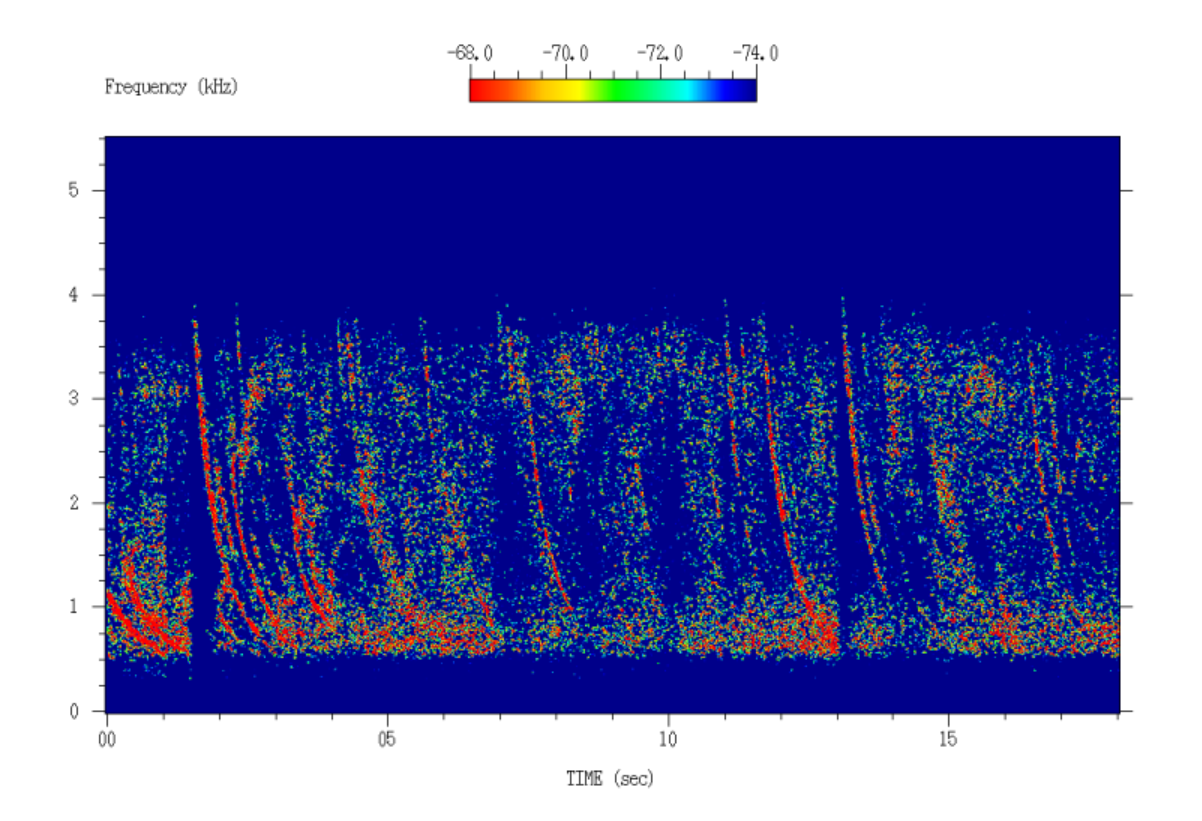
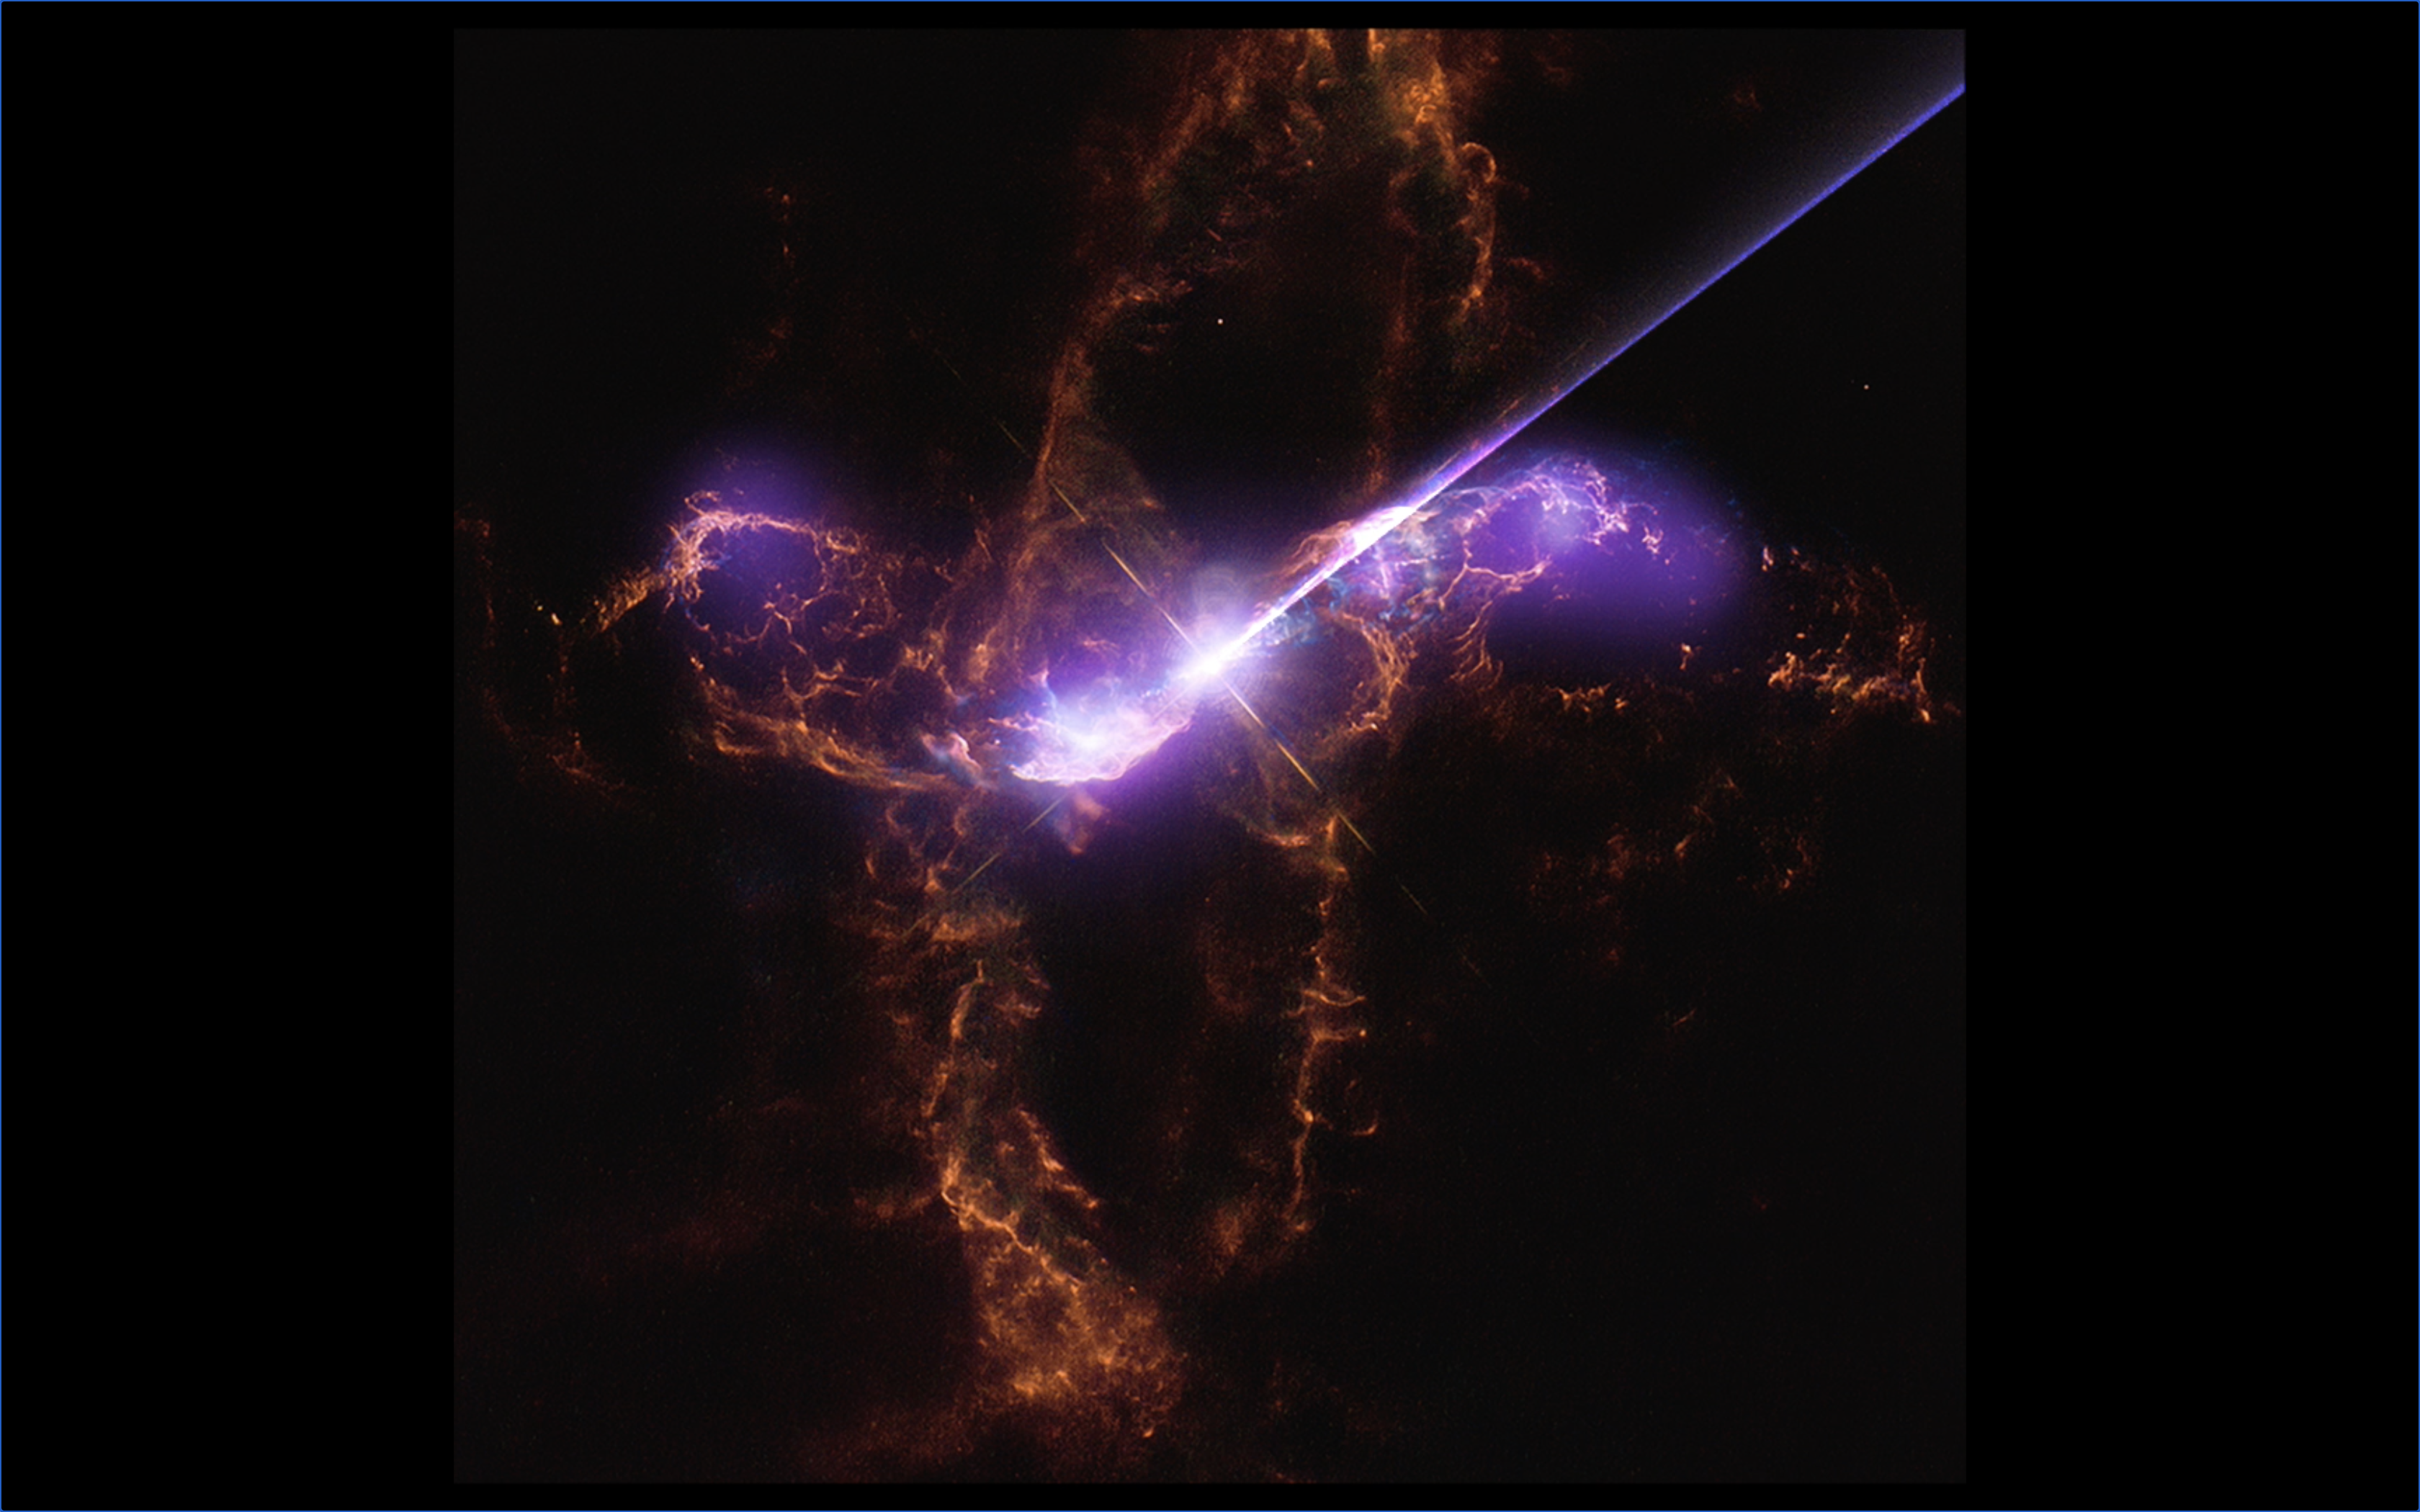
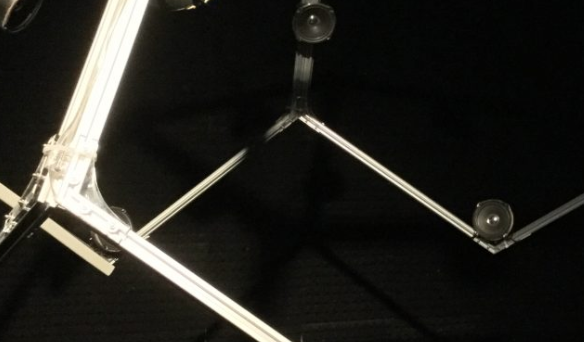
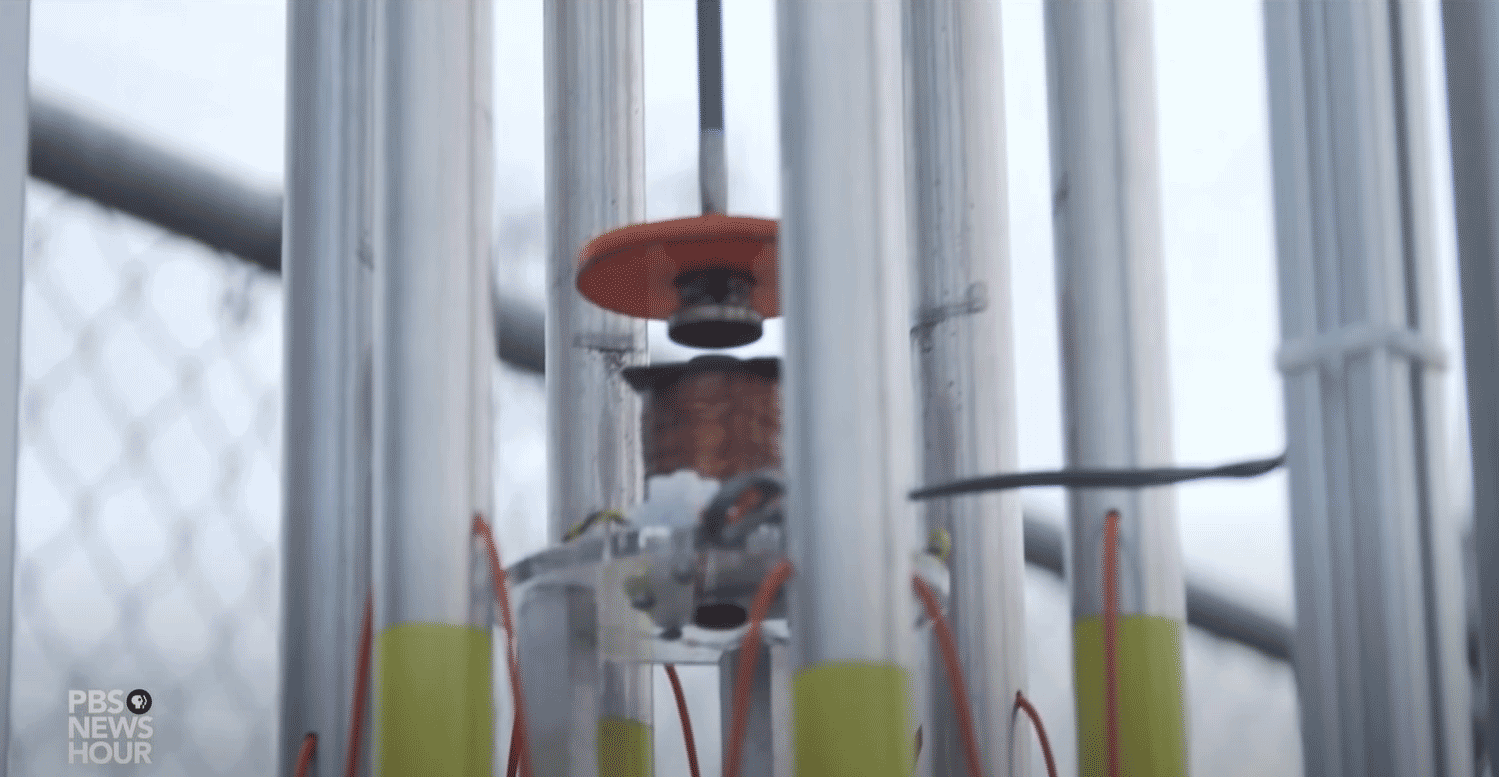
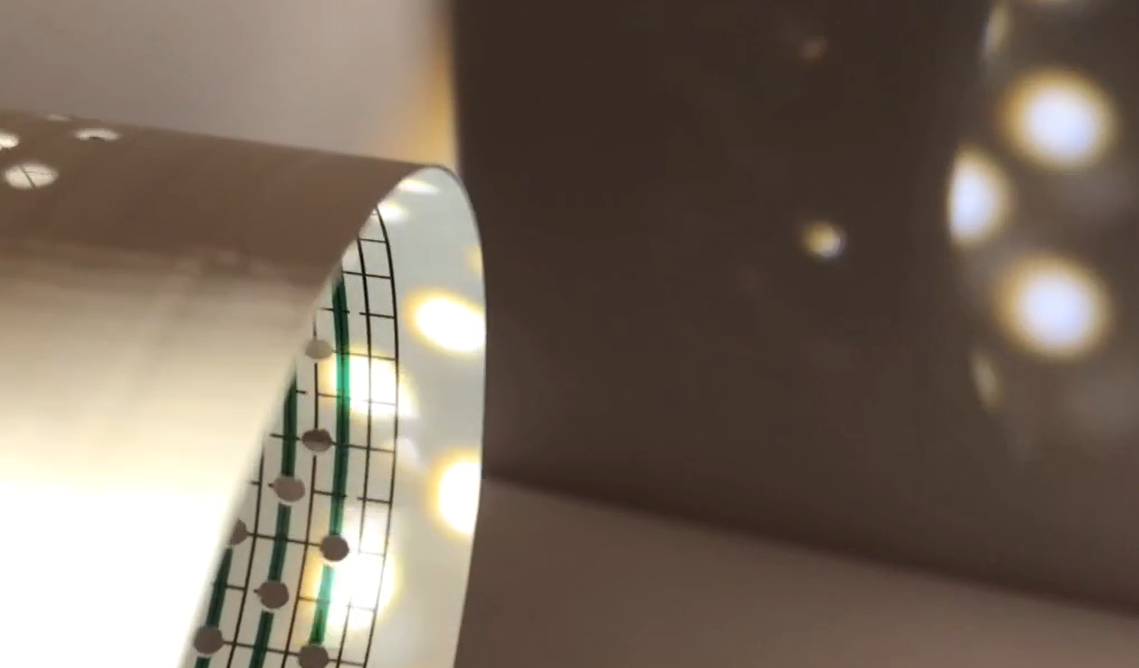
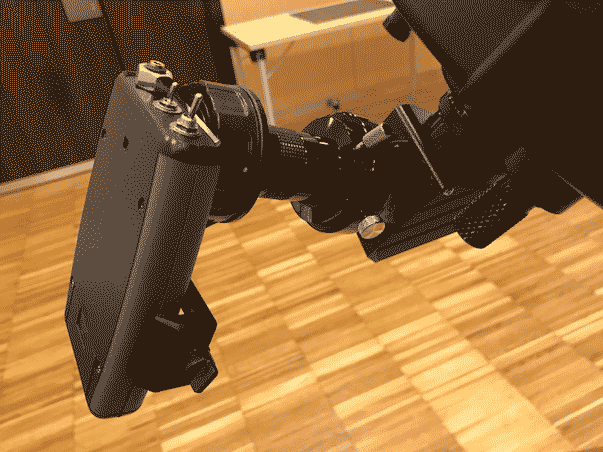
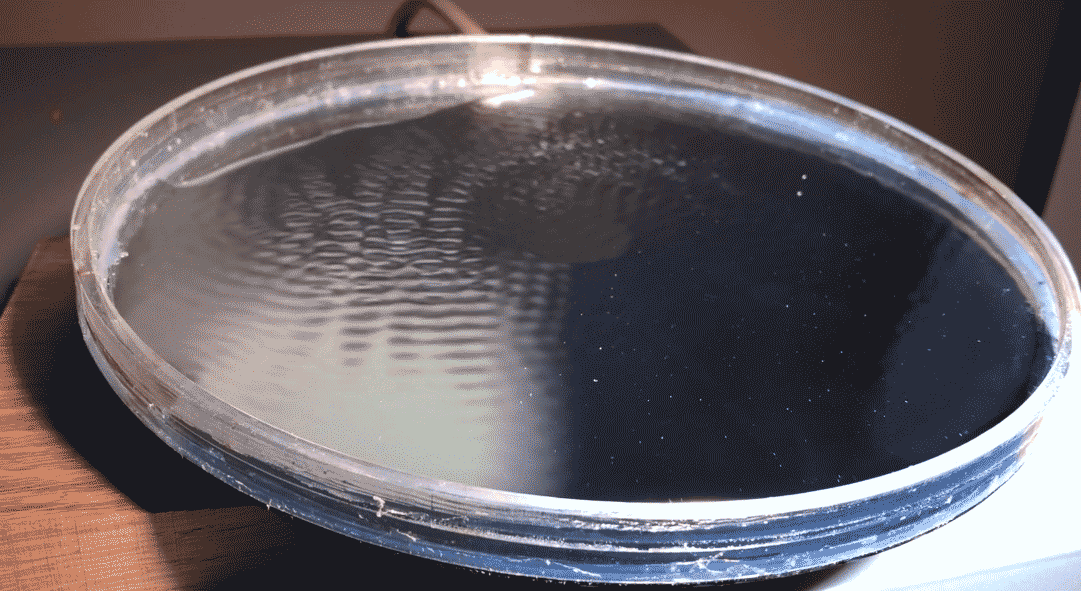
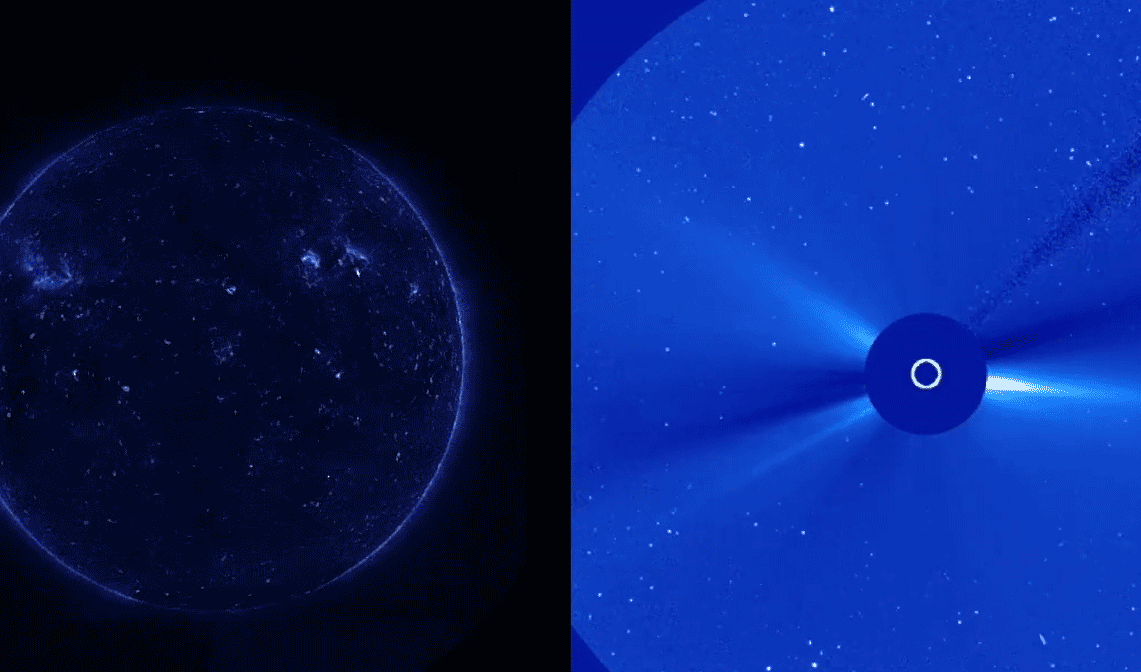
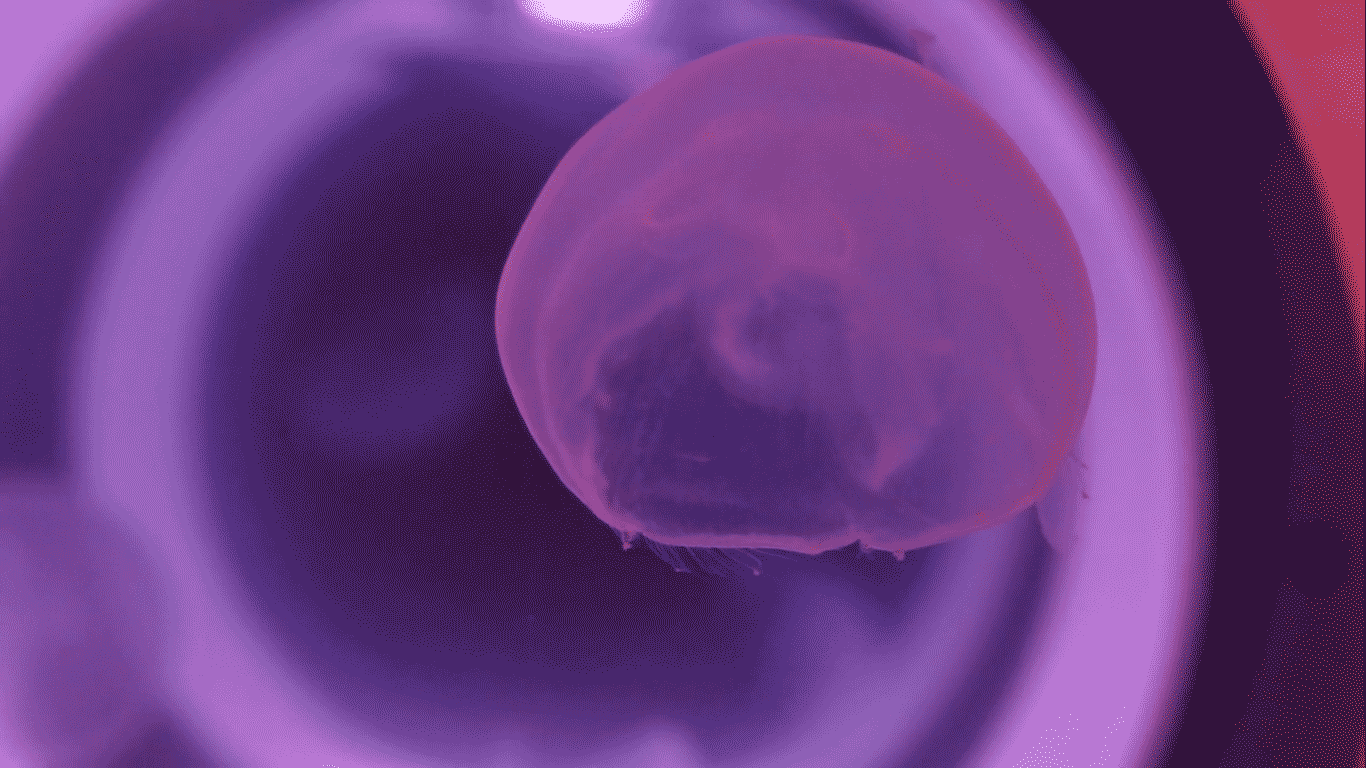
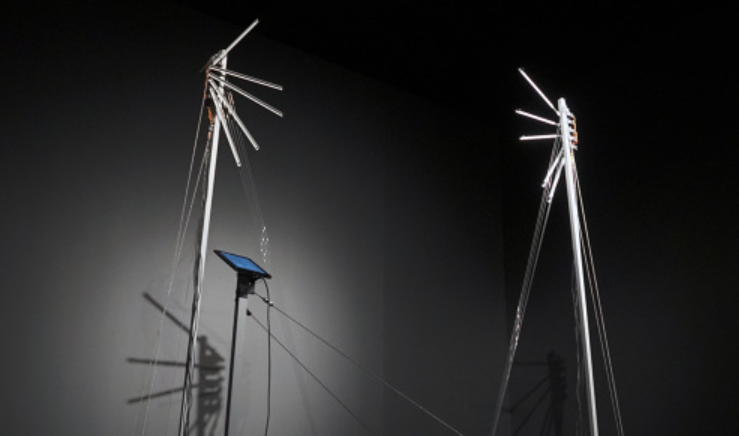
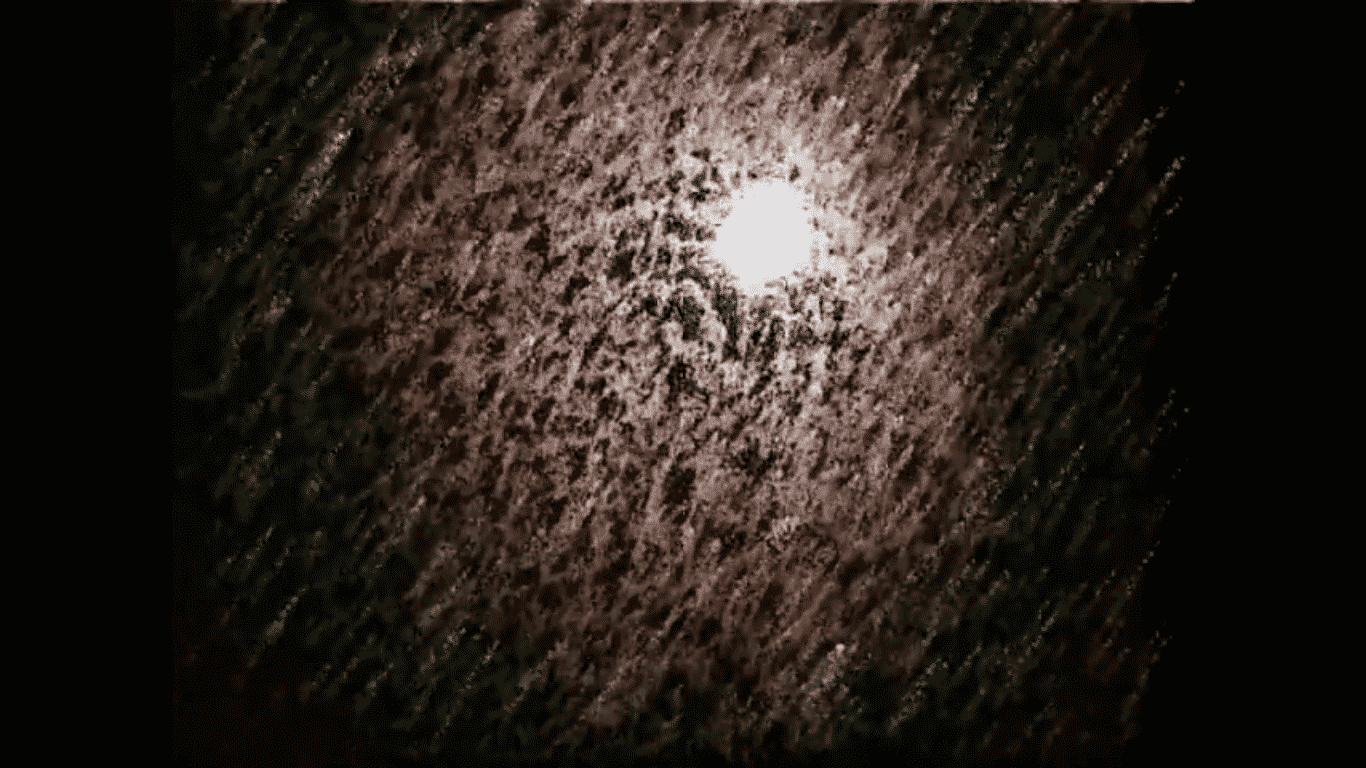
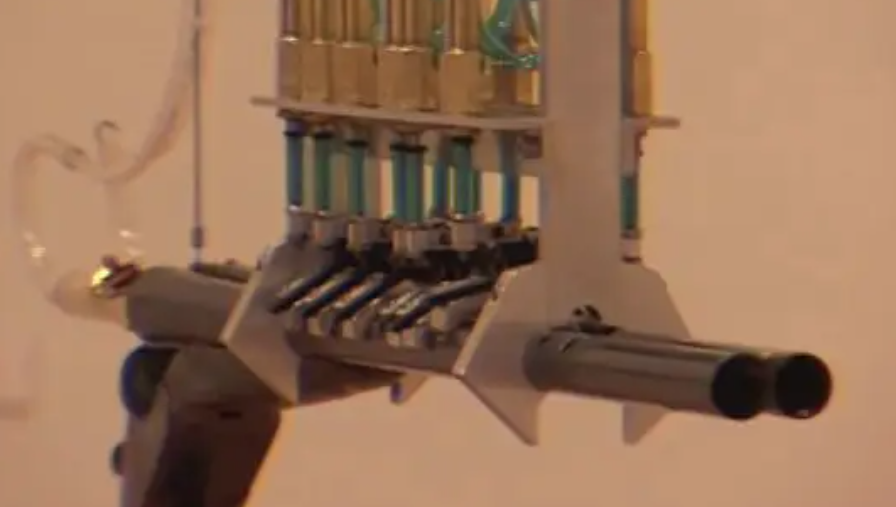
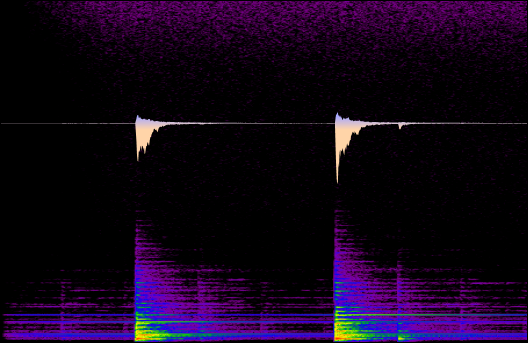
Sonification of a 15 MHz, disc-like micromechanical resonator less than a tenth of a millimetre in diameter that is cooling down to below one thousandth of a Kelvin. The detected vibrations are caused by tiny, random thermal fluctuations and the quantum Heisenberg uncertainty principle. In the sonification, you can hear the vibrating (ringing) drum suddenly changing in frequency and getting louder. This 'switching' event was caused by a short-lived warm-up of the resonator by a few thousandths of a Kelvin. By 'listening' instead of looking as we usually do at scientific data, we can sometimes discover short-lived signals, like this switching event.
The sonified drum tone was chosen to closely match that of a beehive recording made on an early autumn day, 2020.
Experimental data and photos courtesy of Eddy Collin, Université Grenoble Alpes
Device image courtesy of Laure Mercier de Lépinay and Mika Sillanpää, Aalto University
For more information about the experiment, see:
https://doi.org/10.1038/s41467-021-26457-8
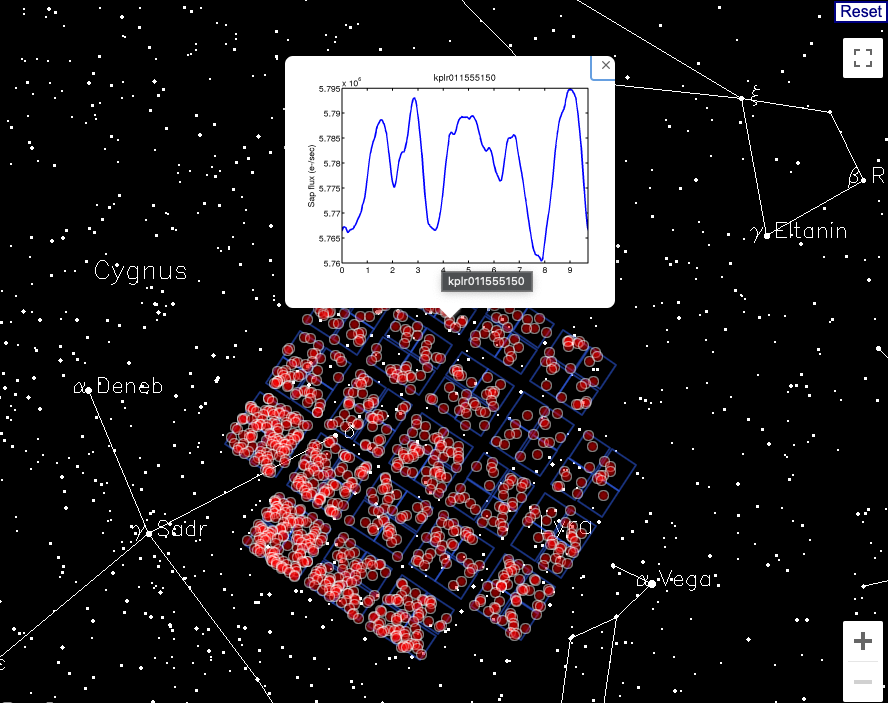
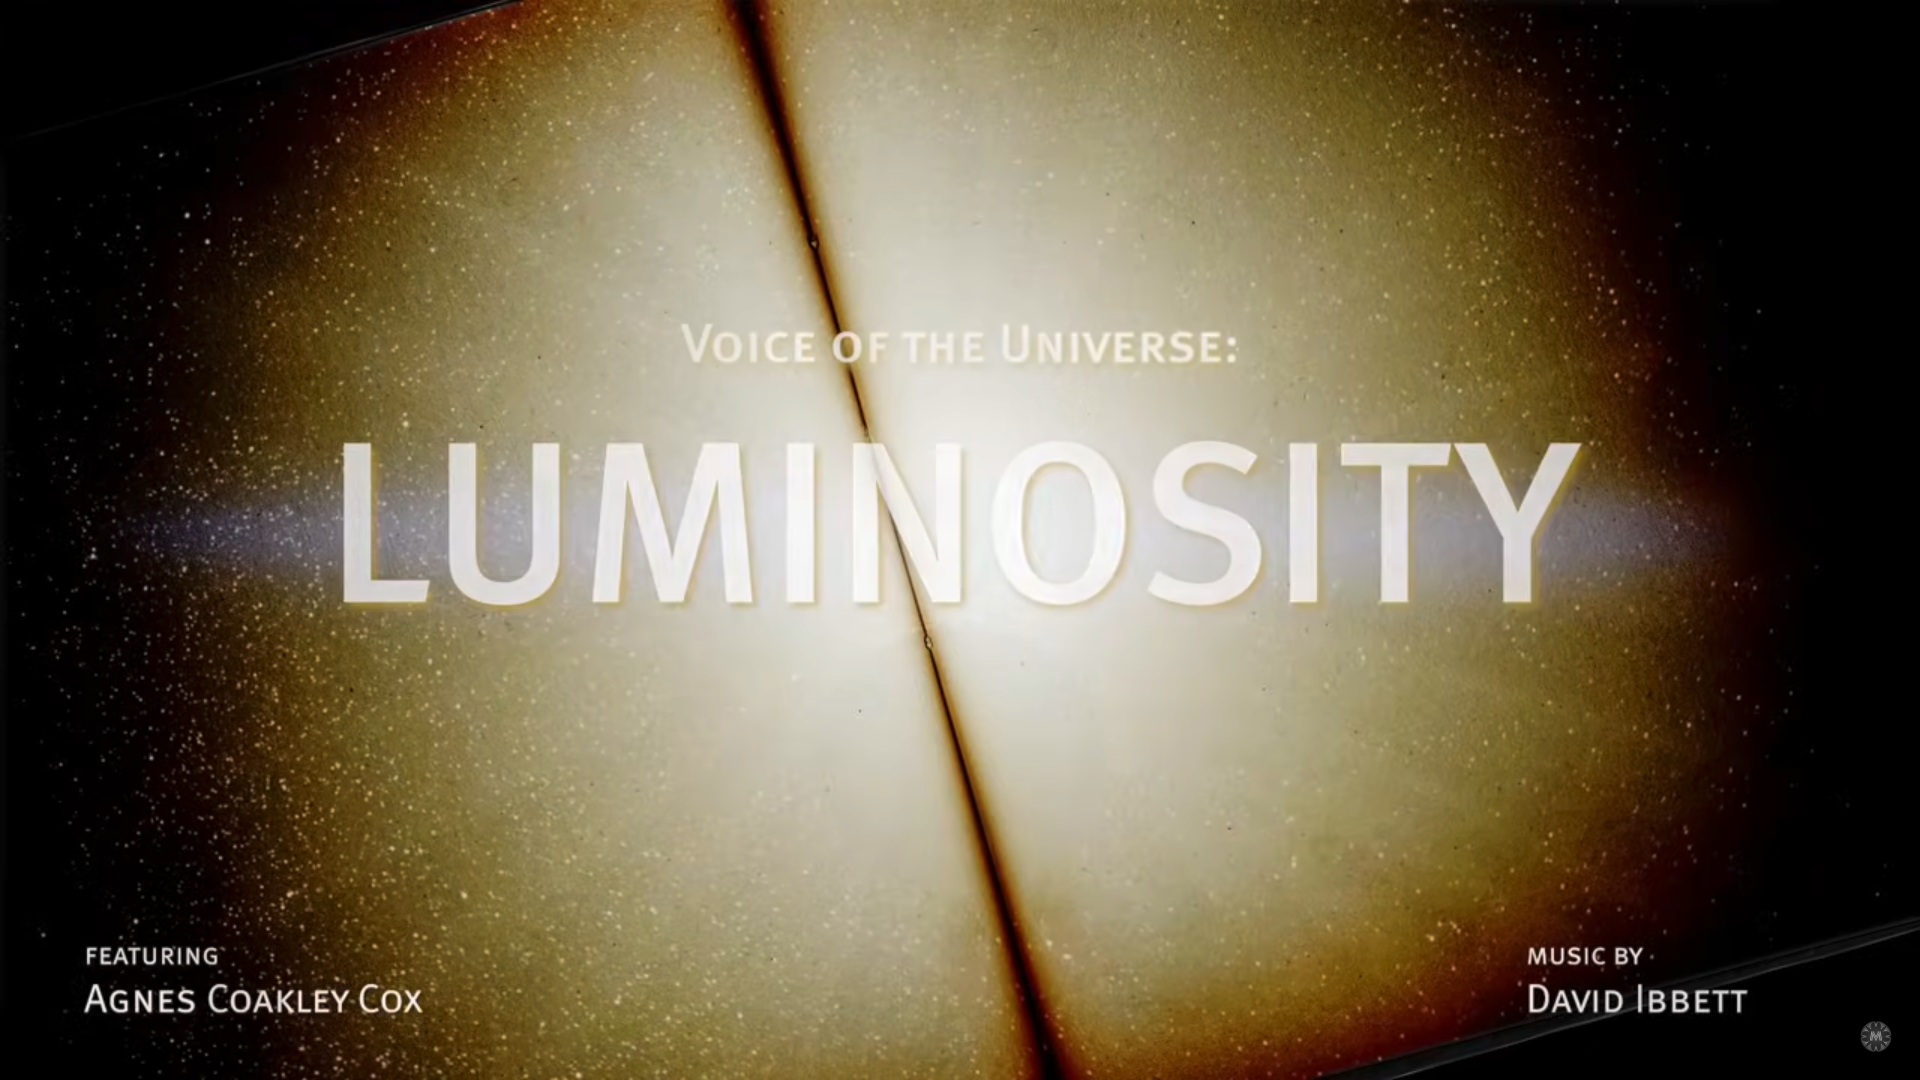
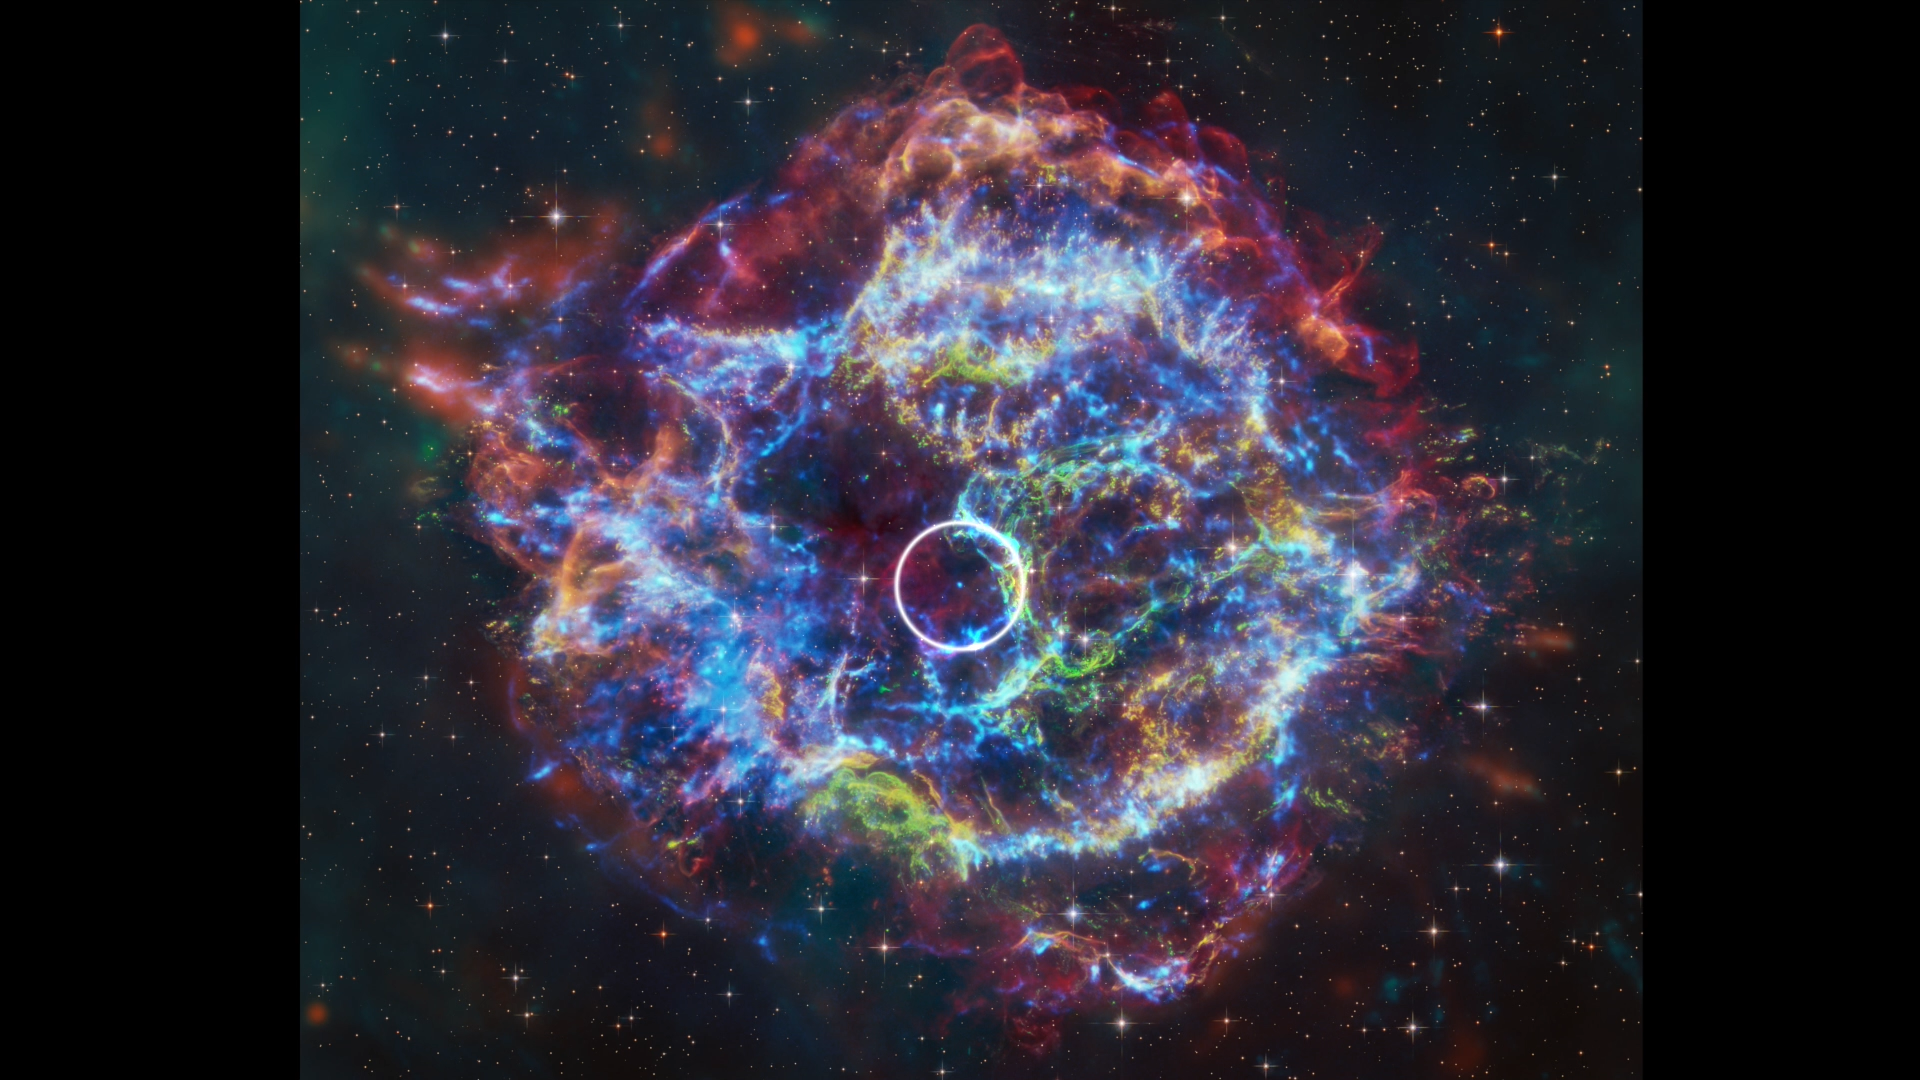
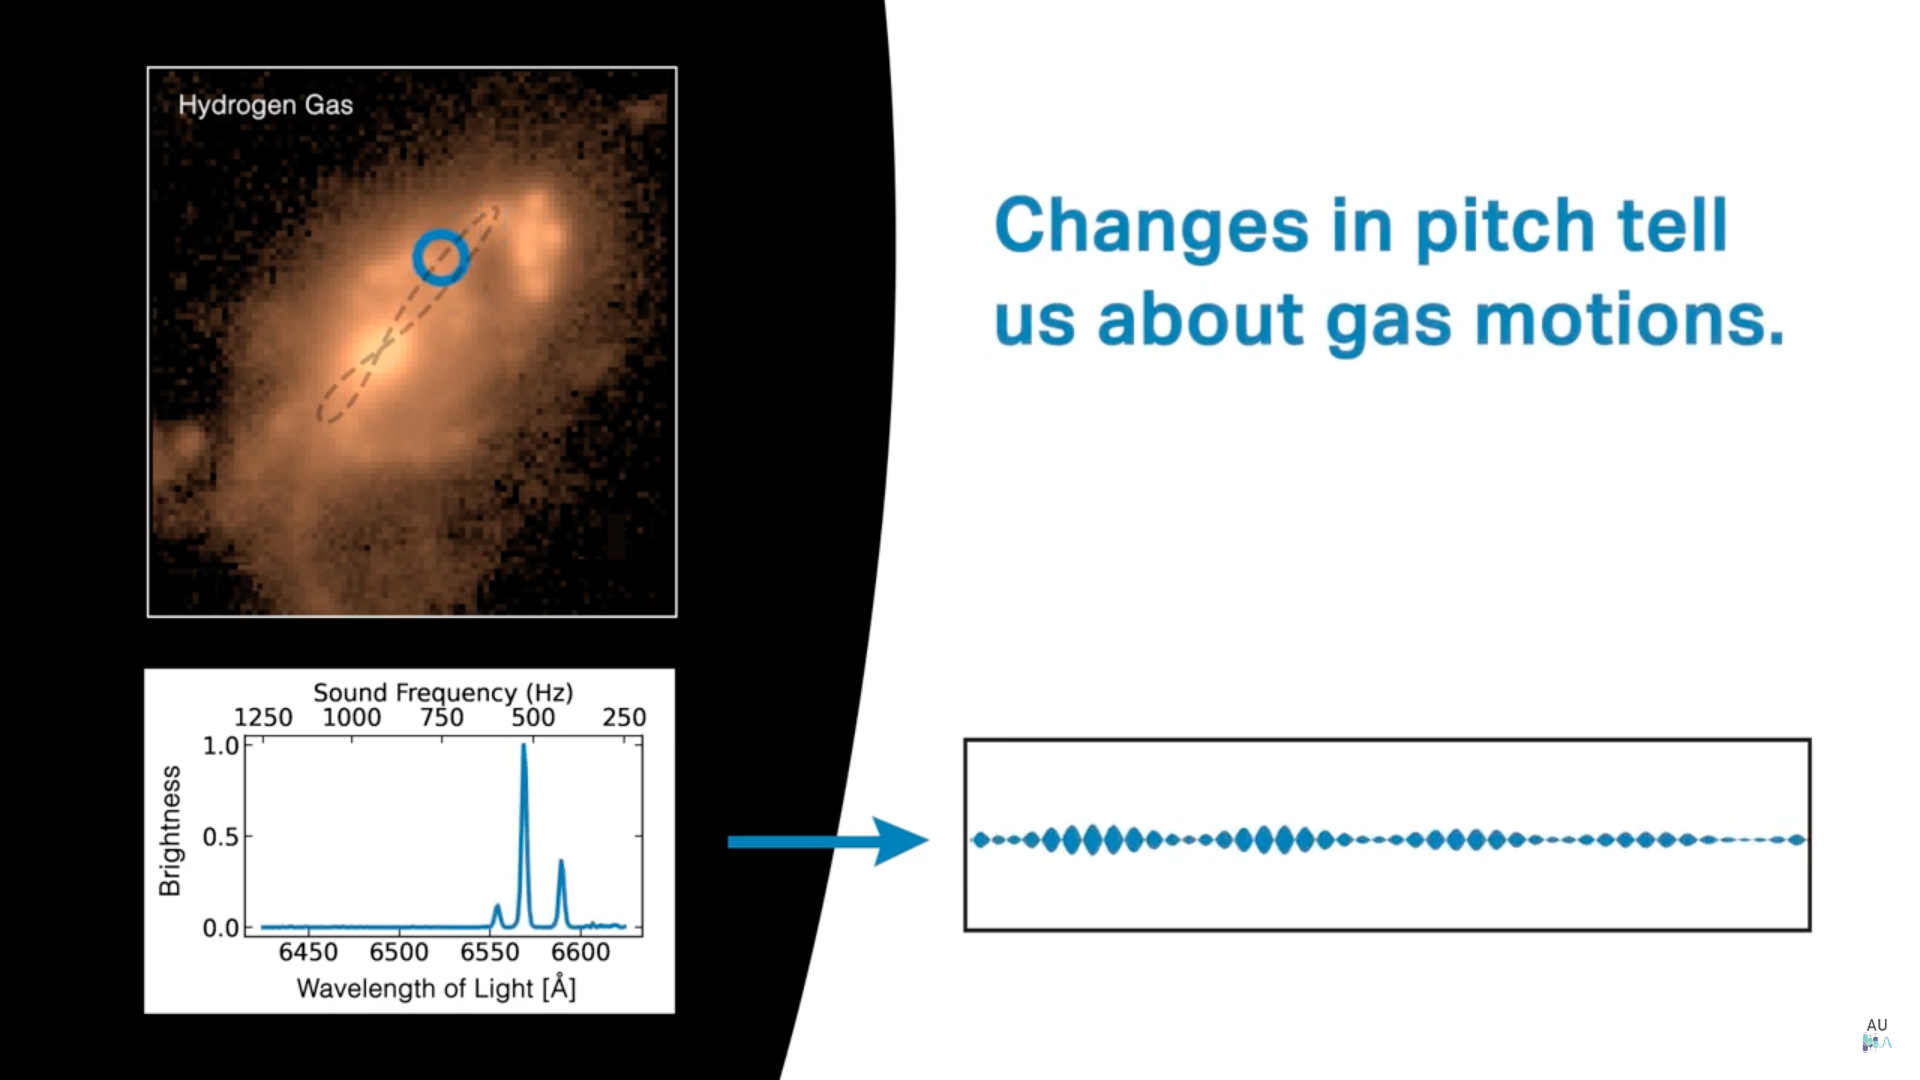
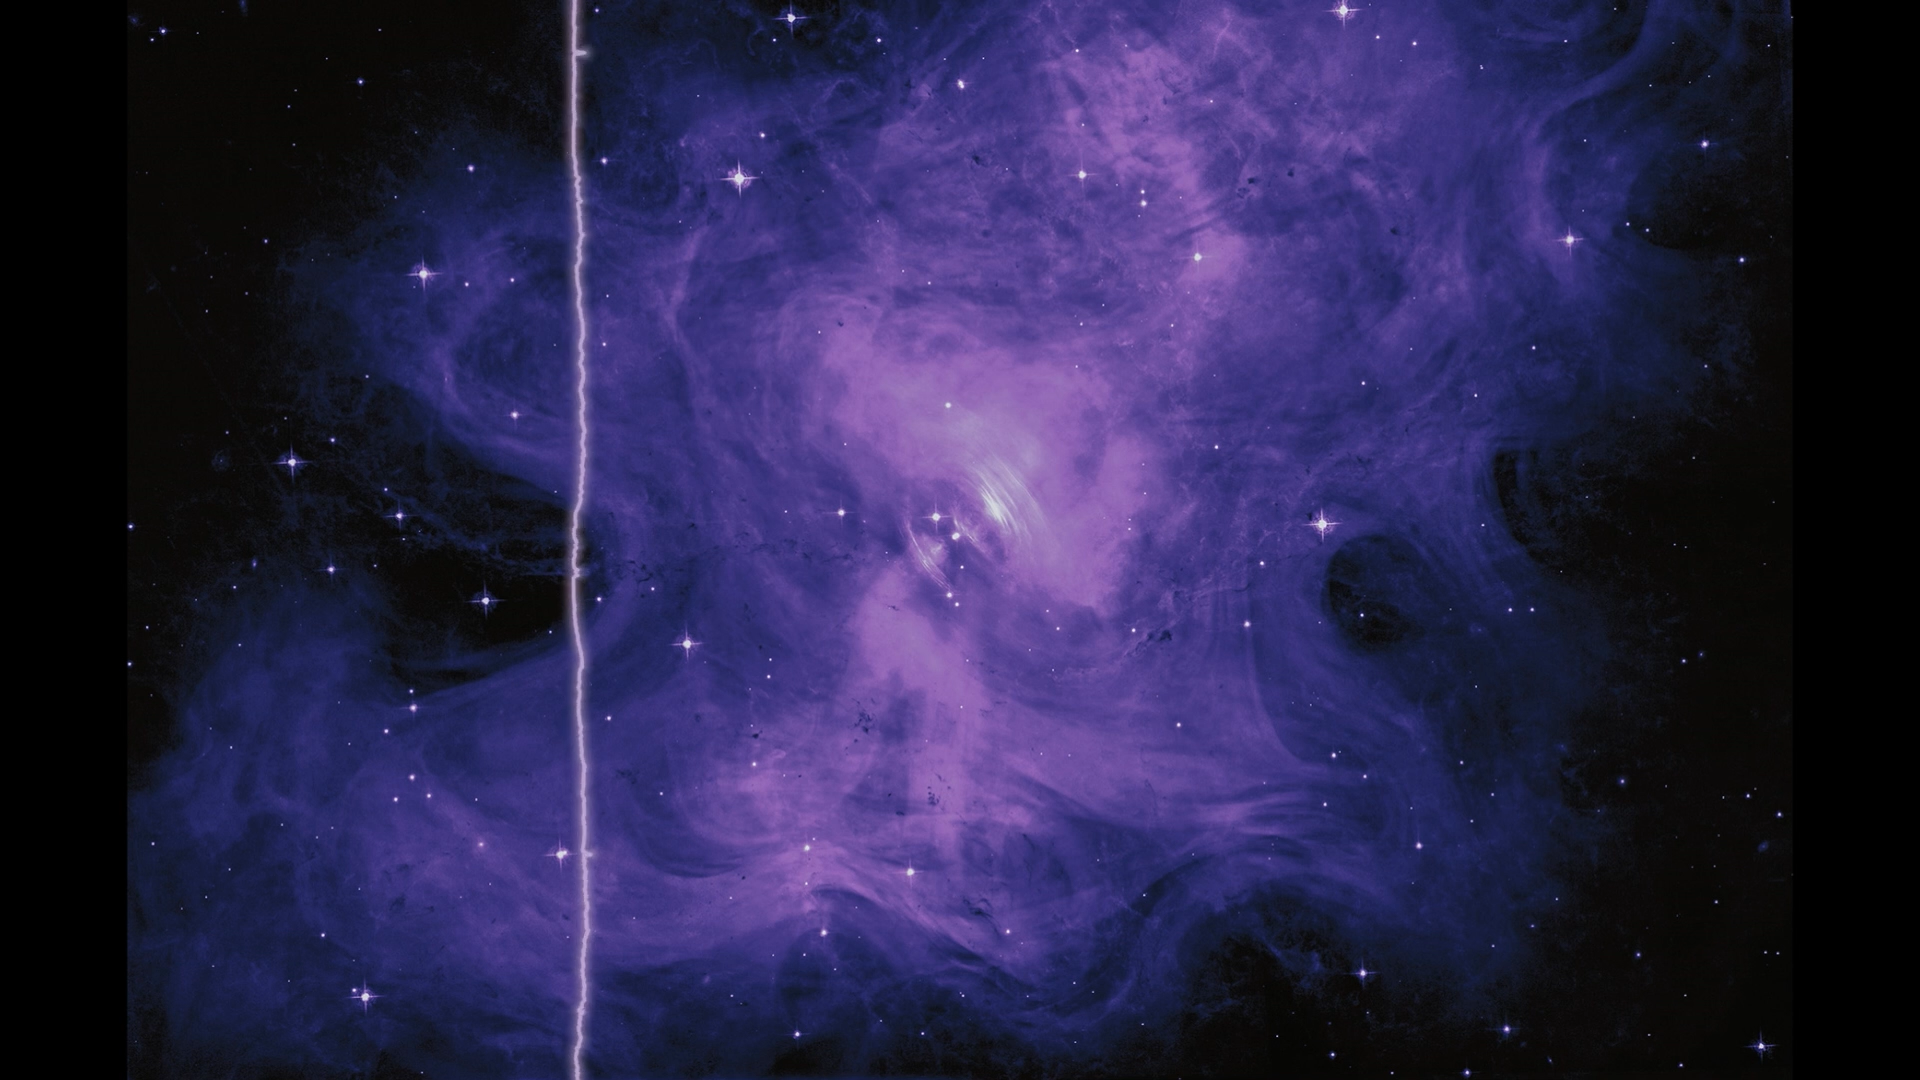
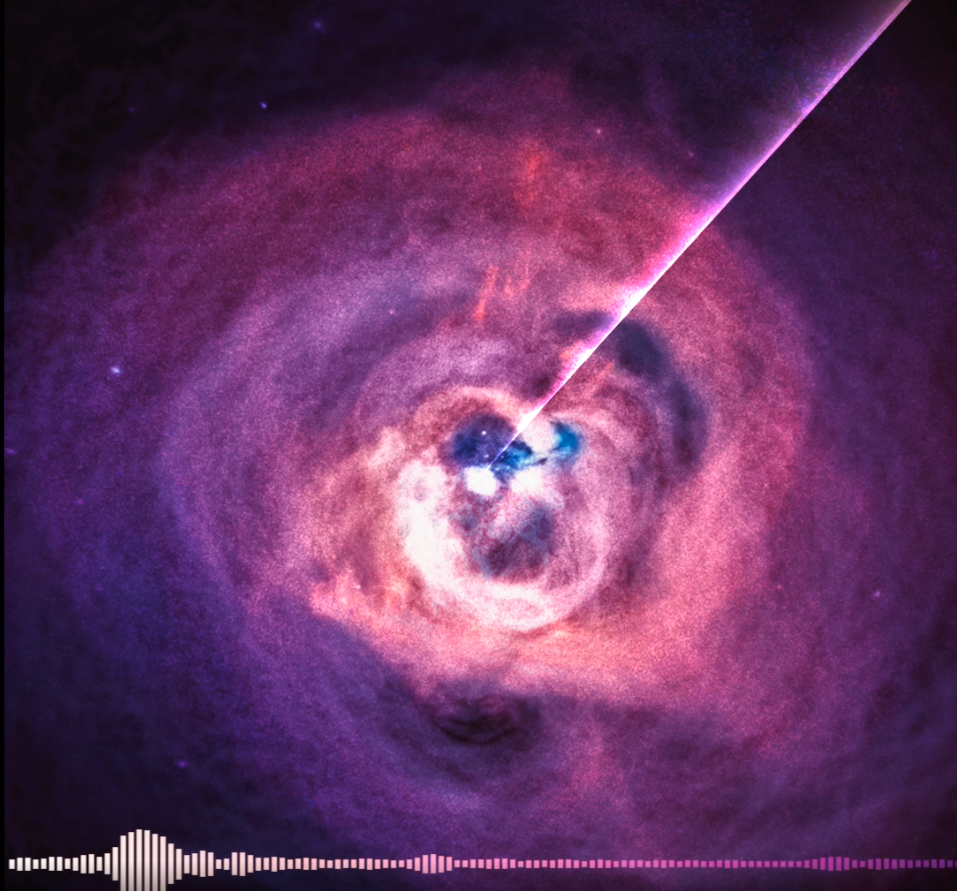
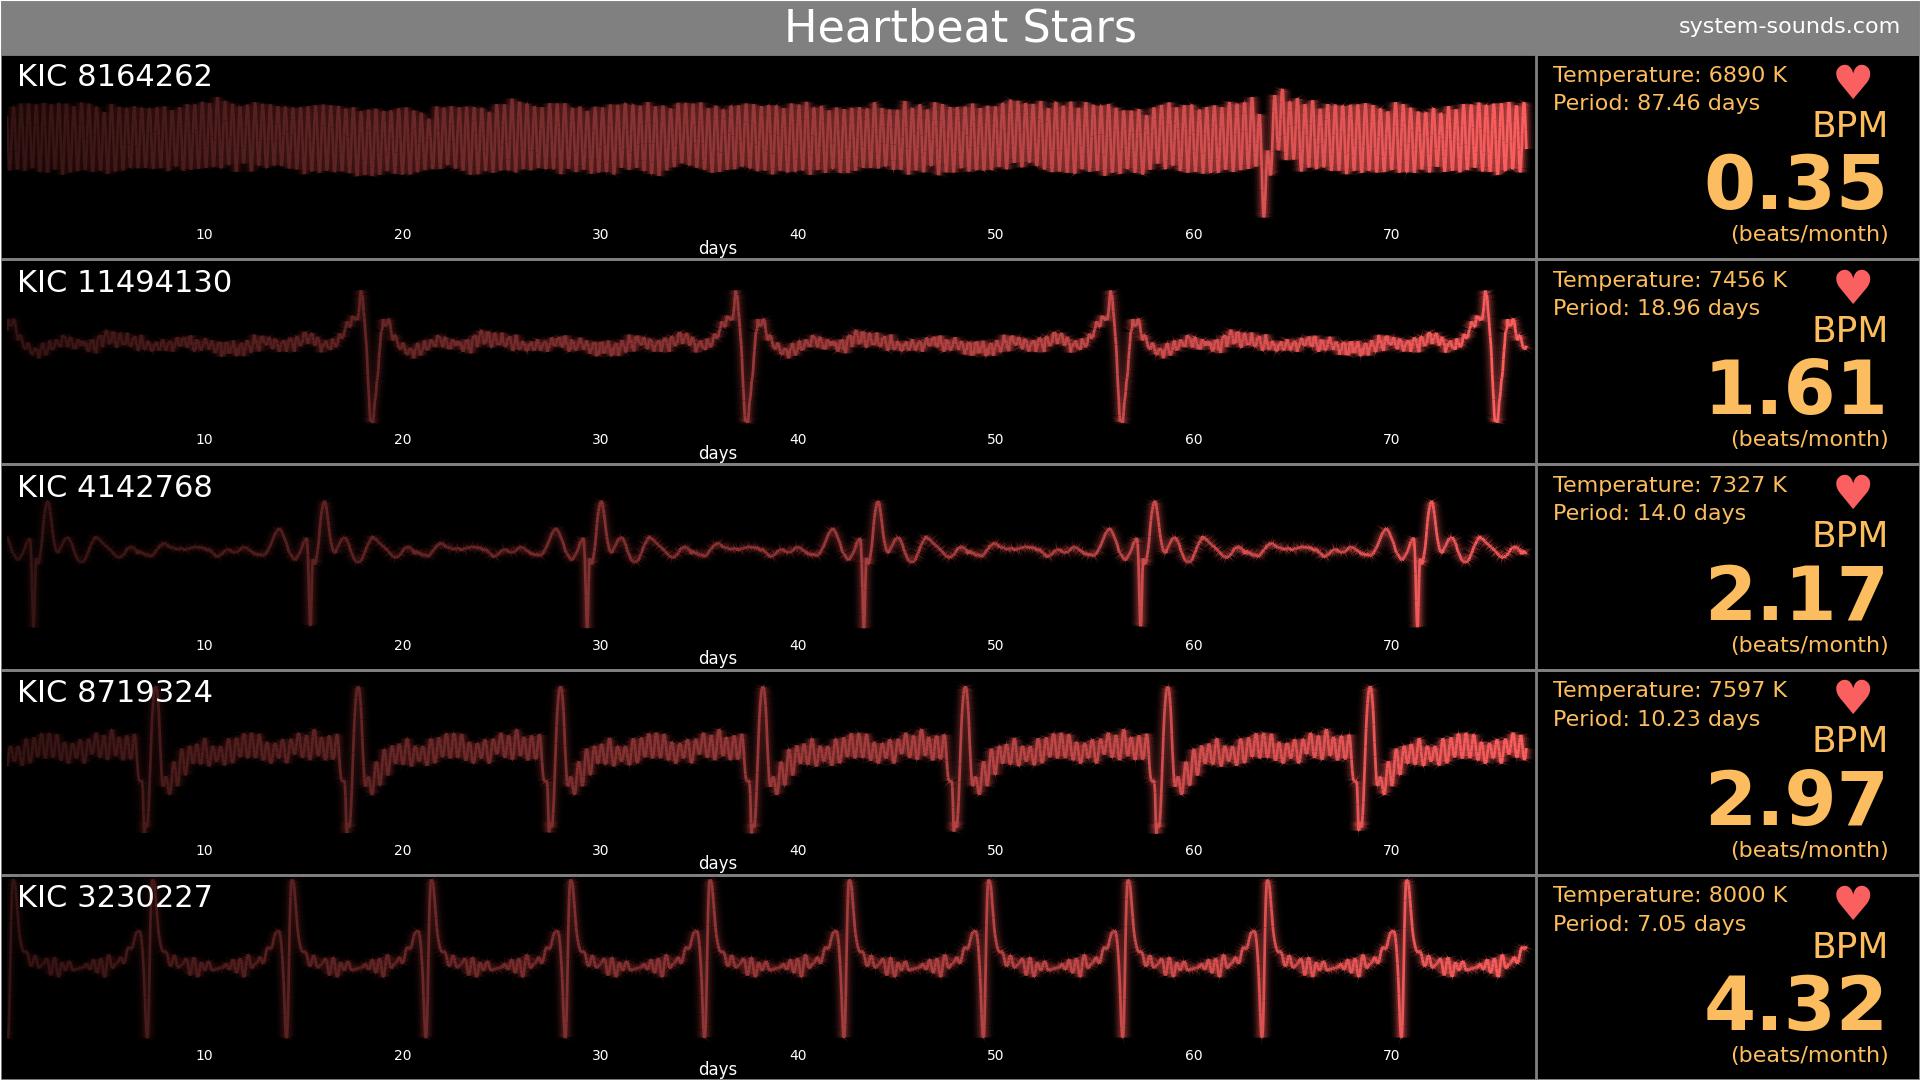
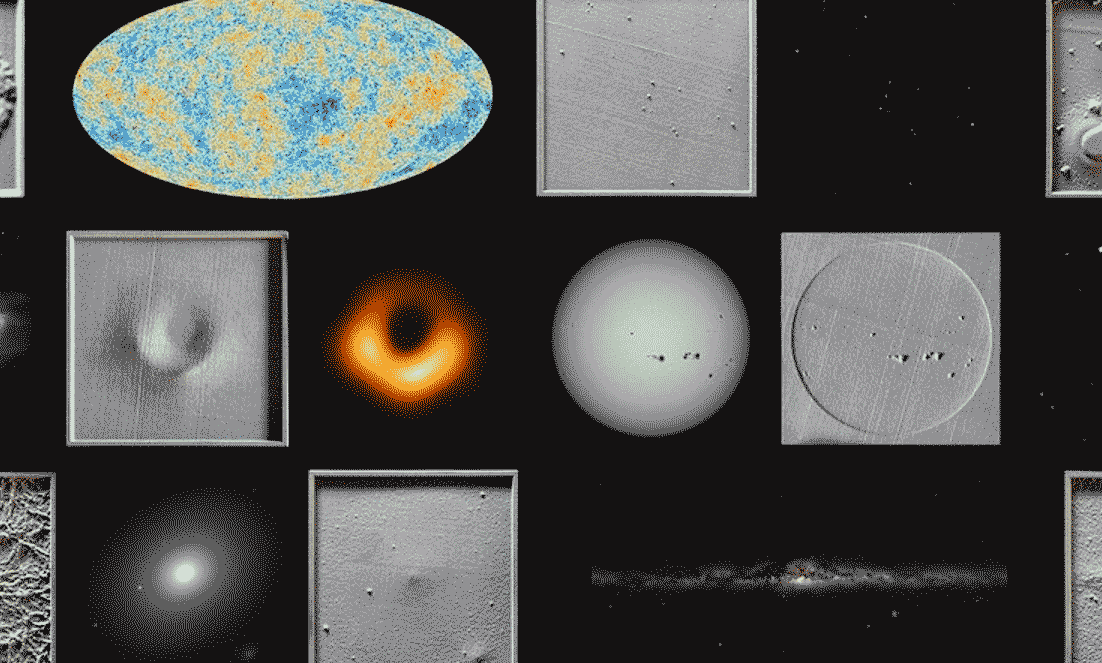
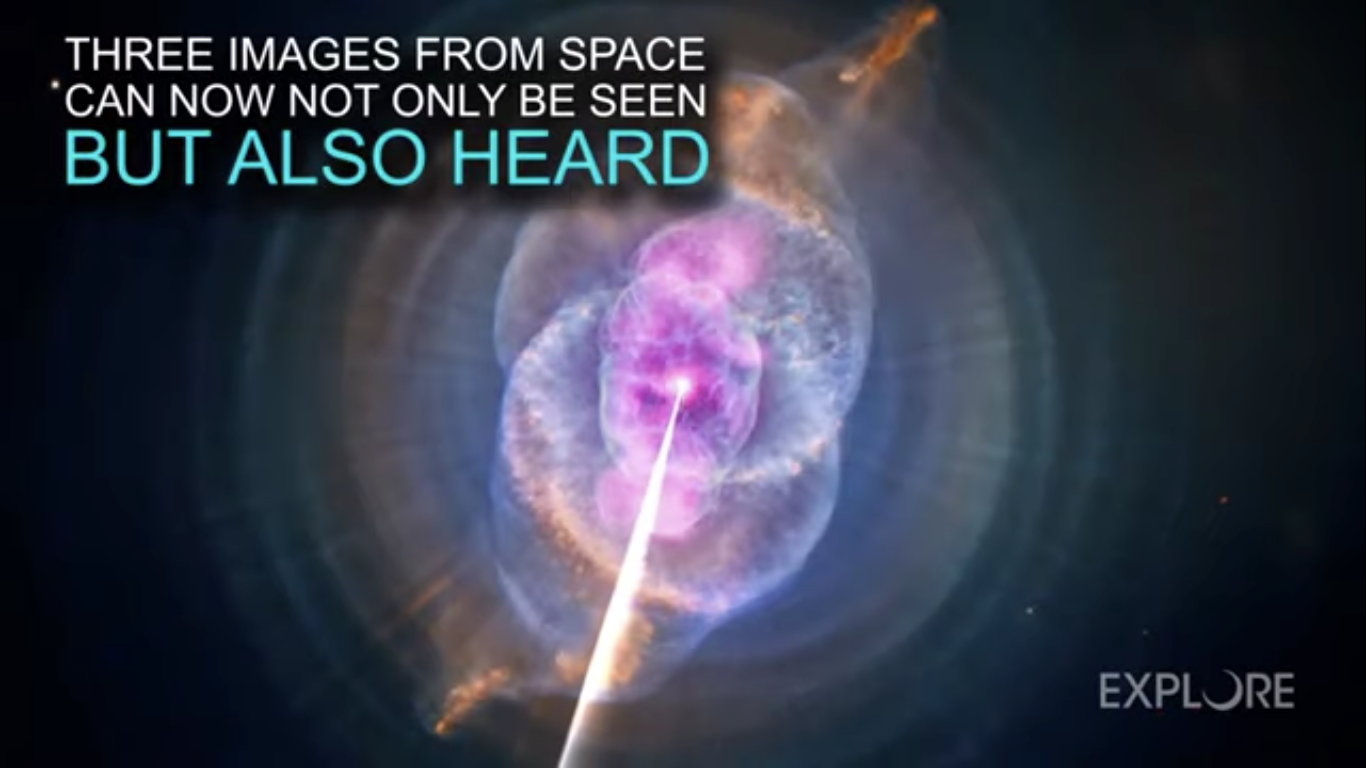
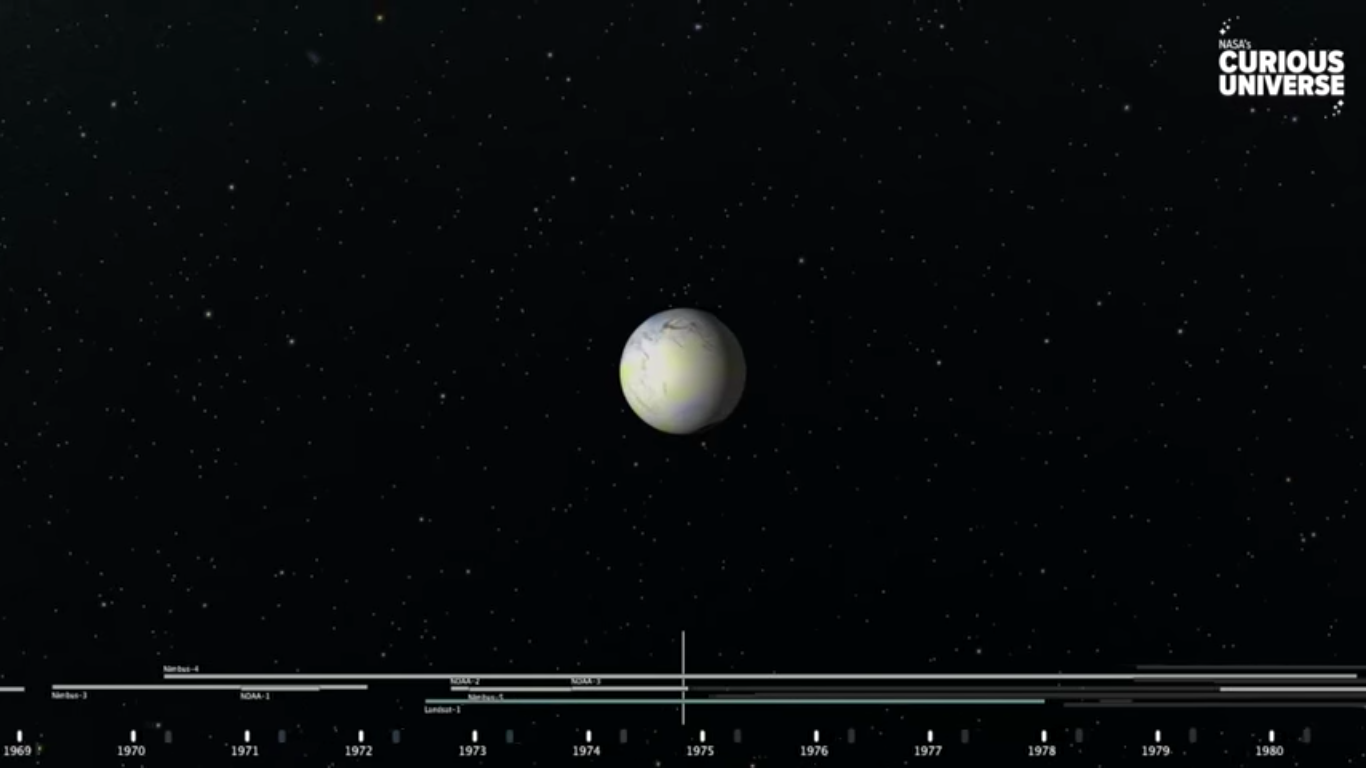
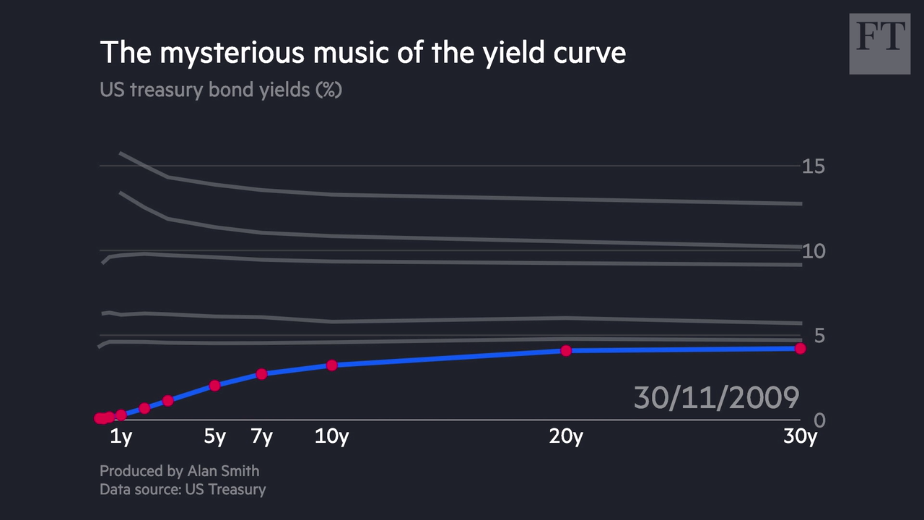
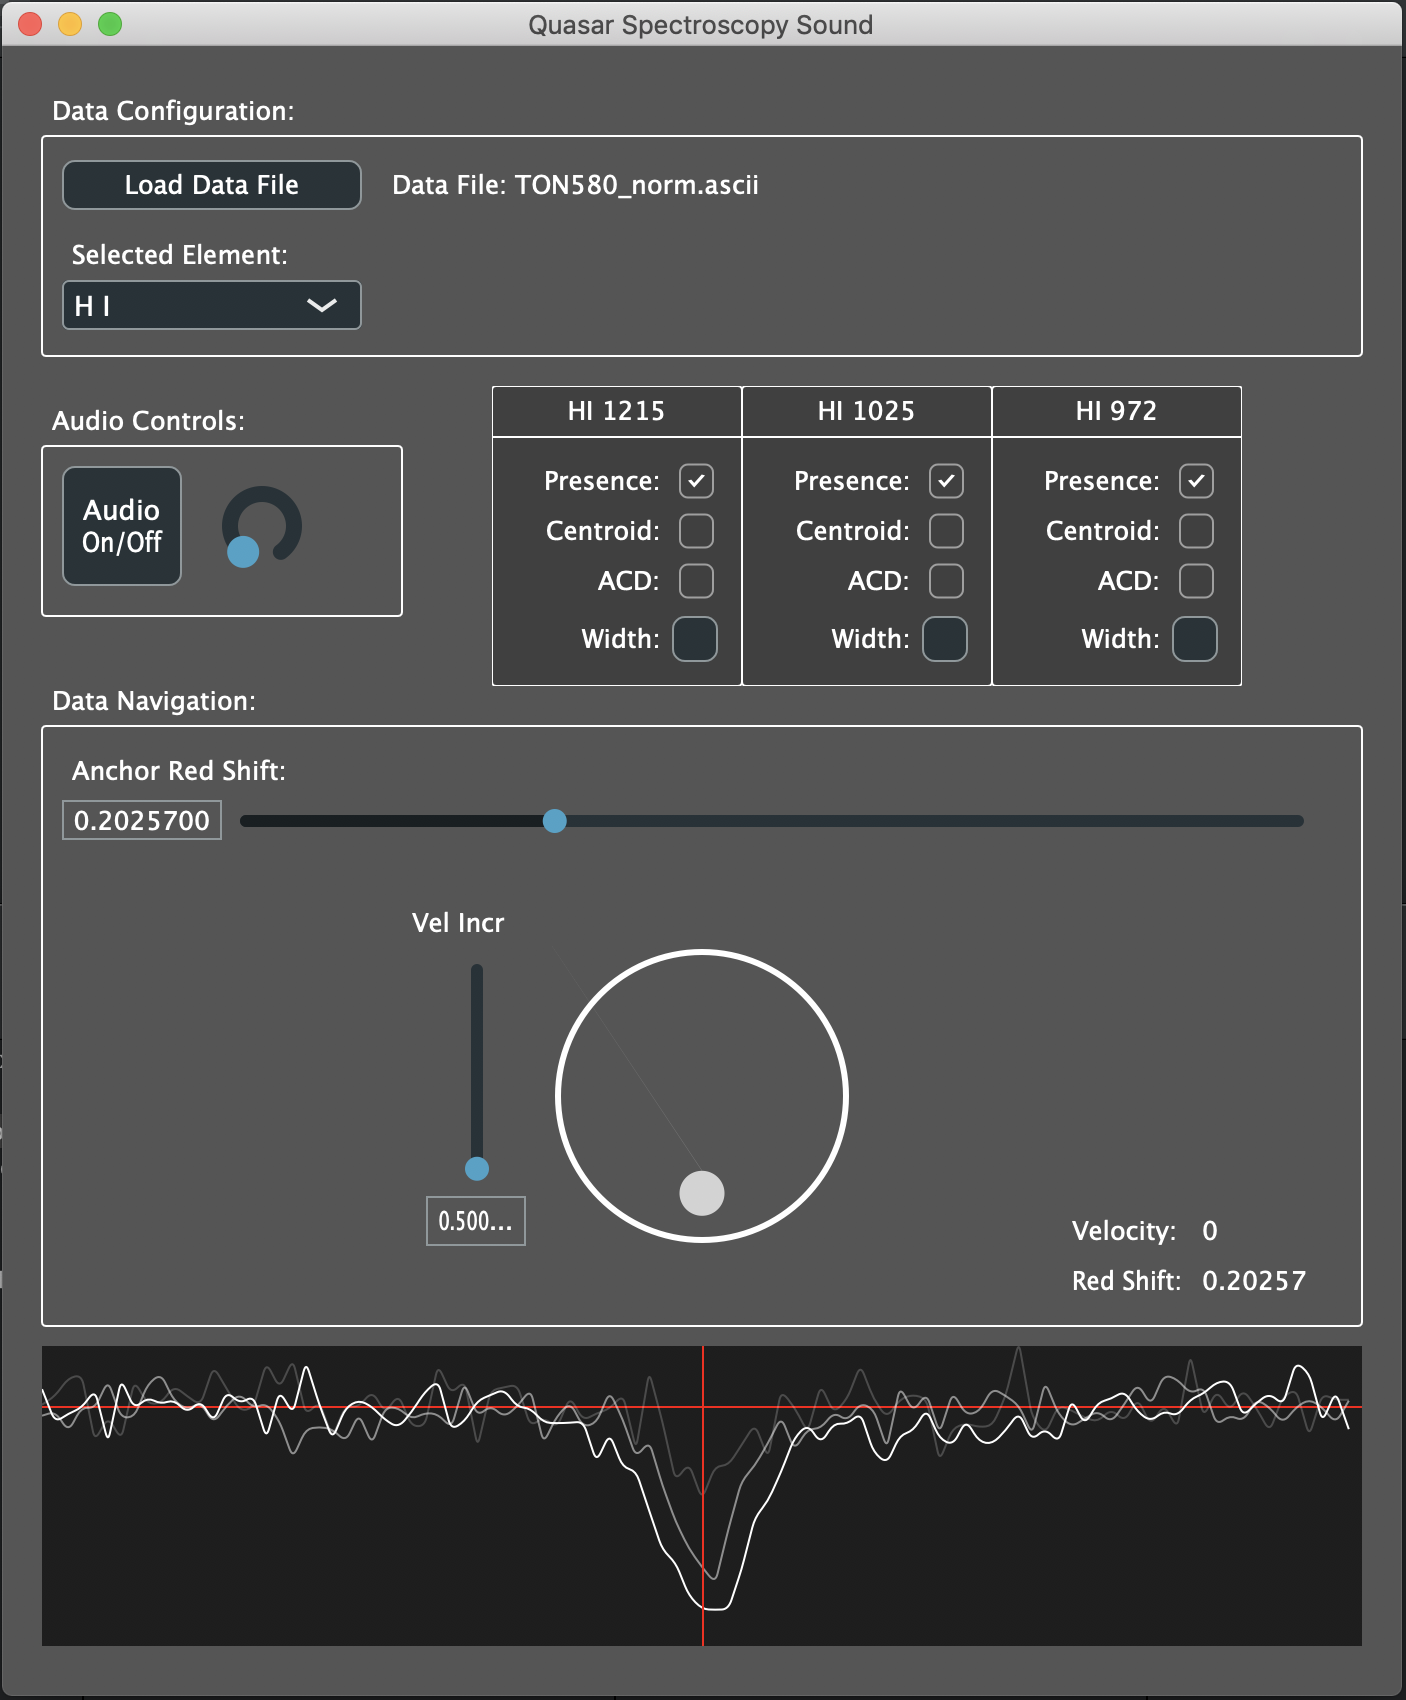
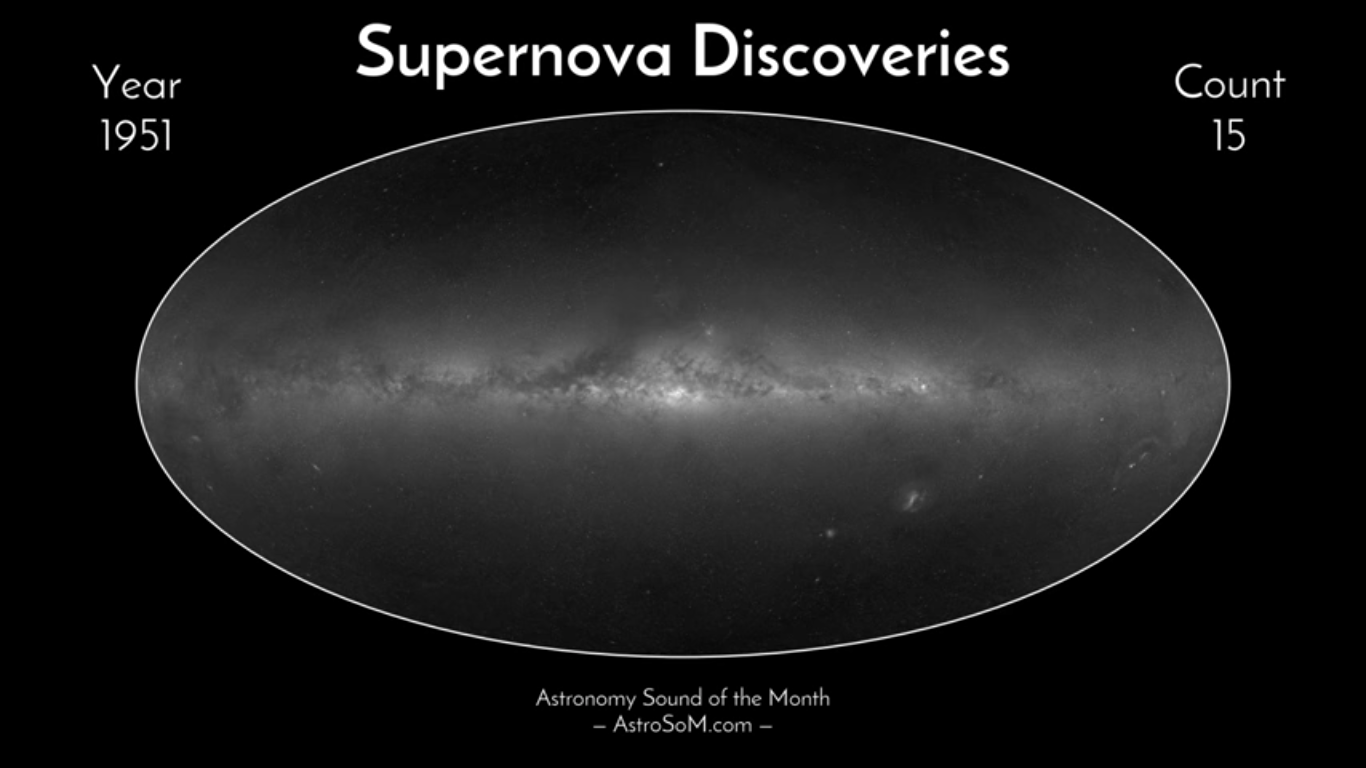
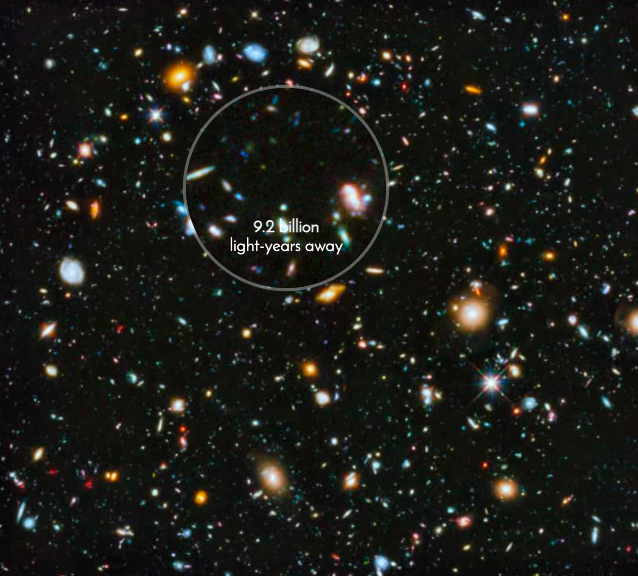
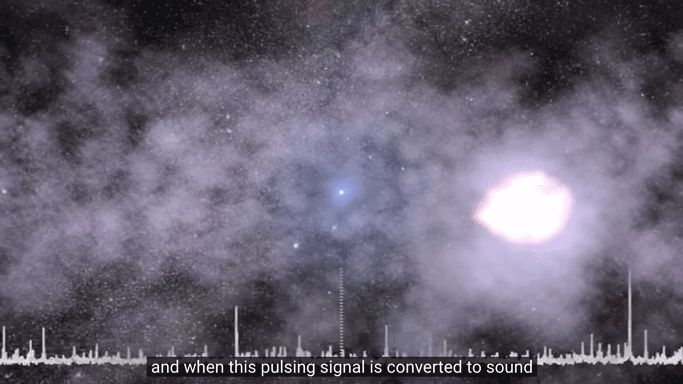
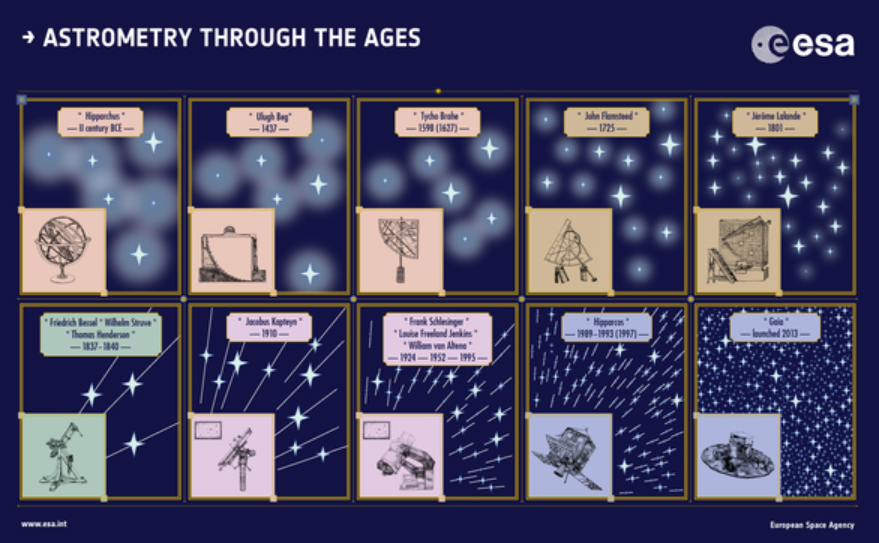
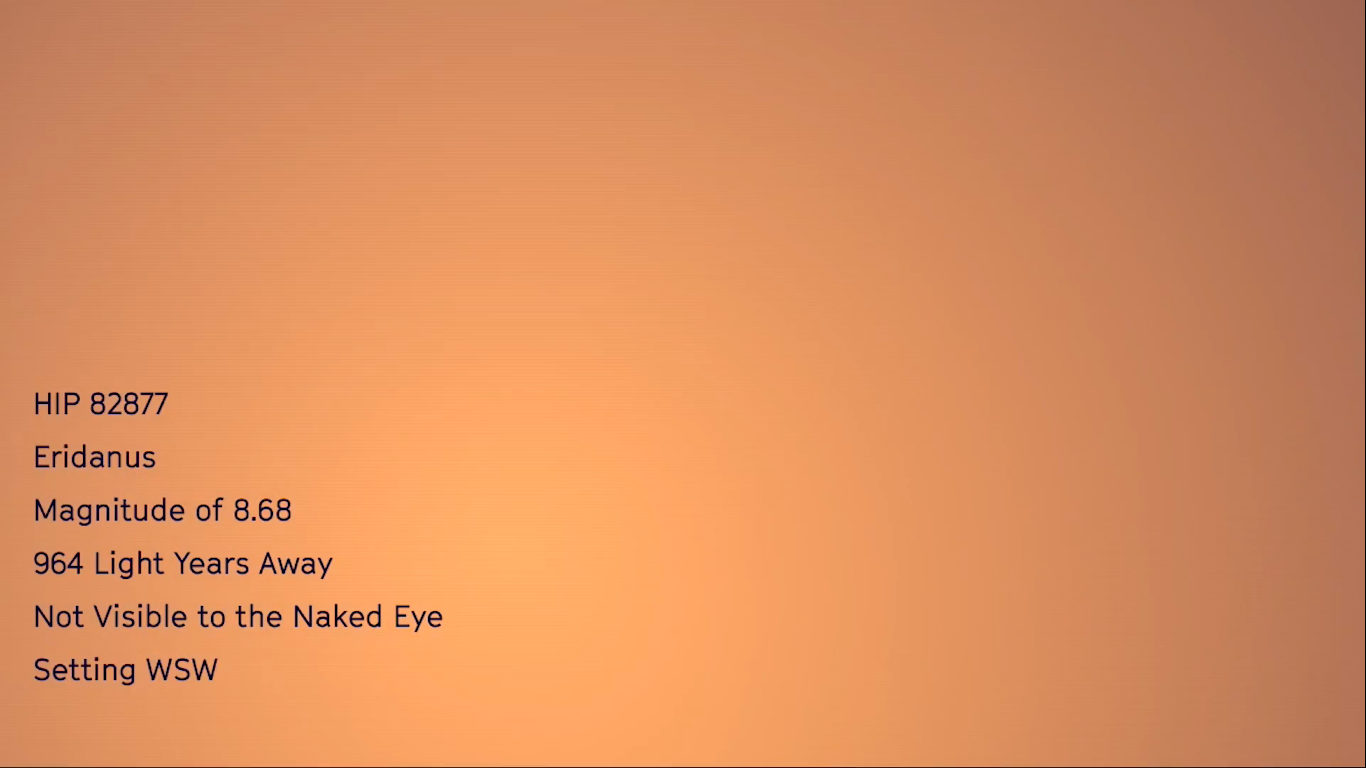
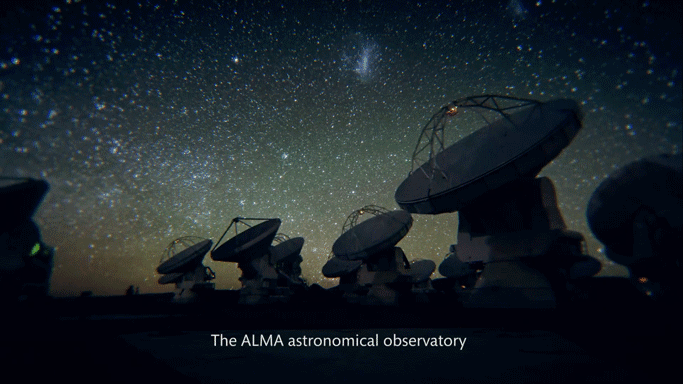
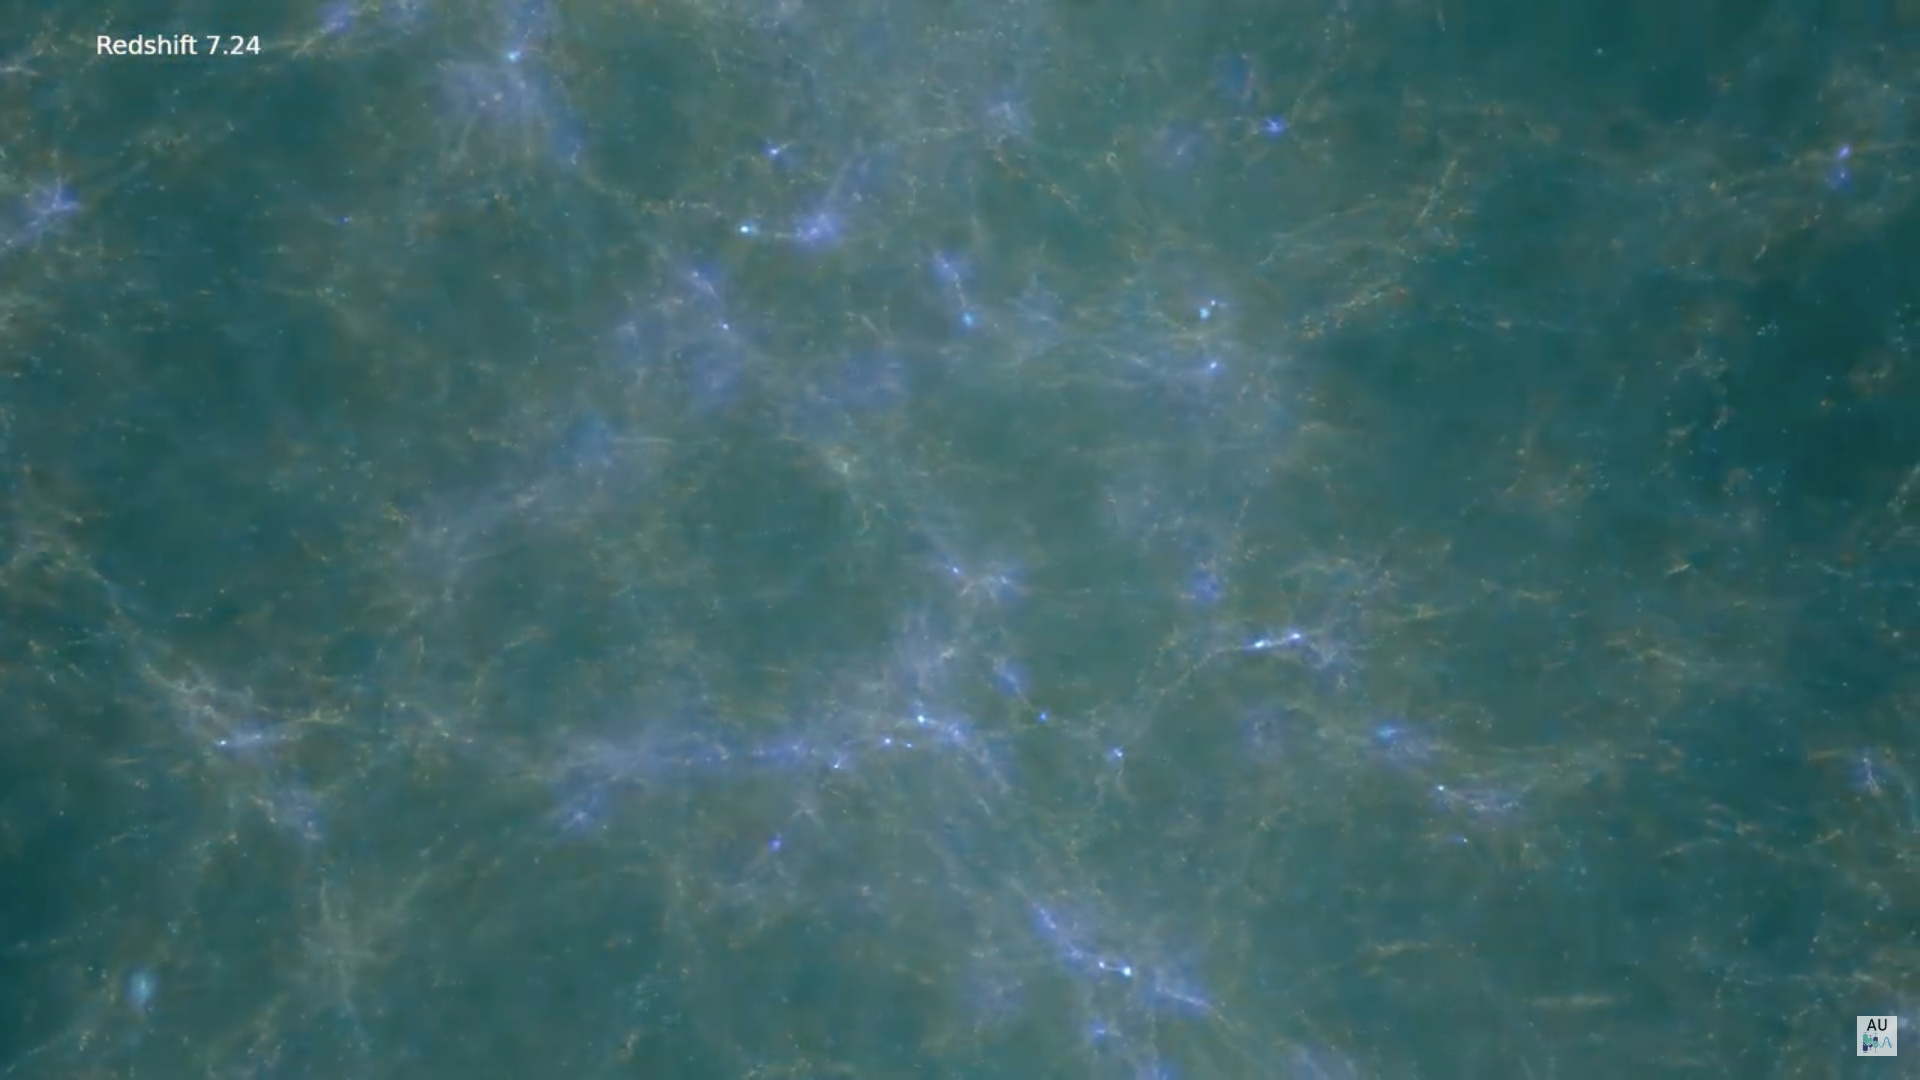
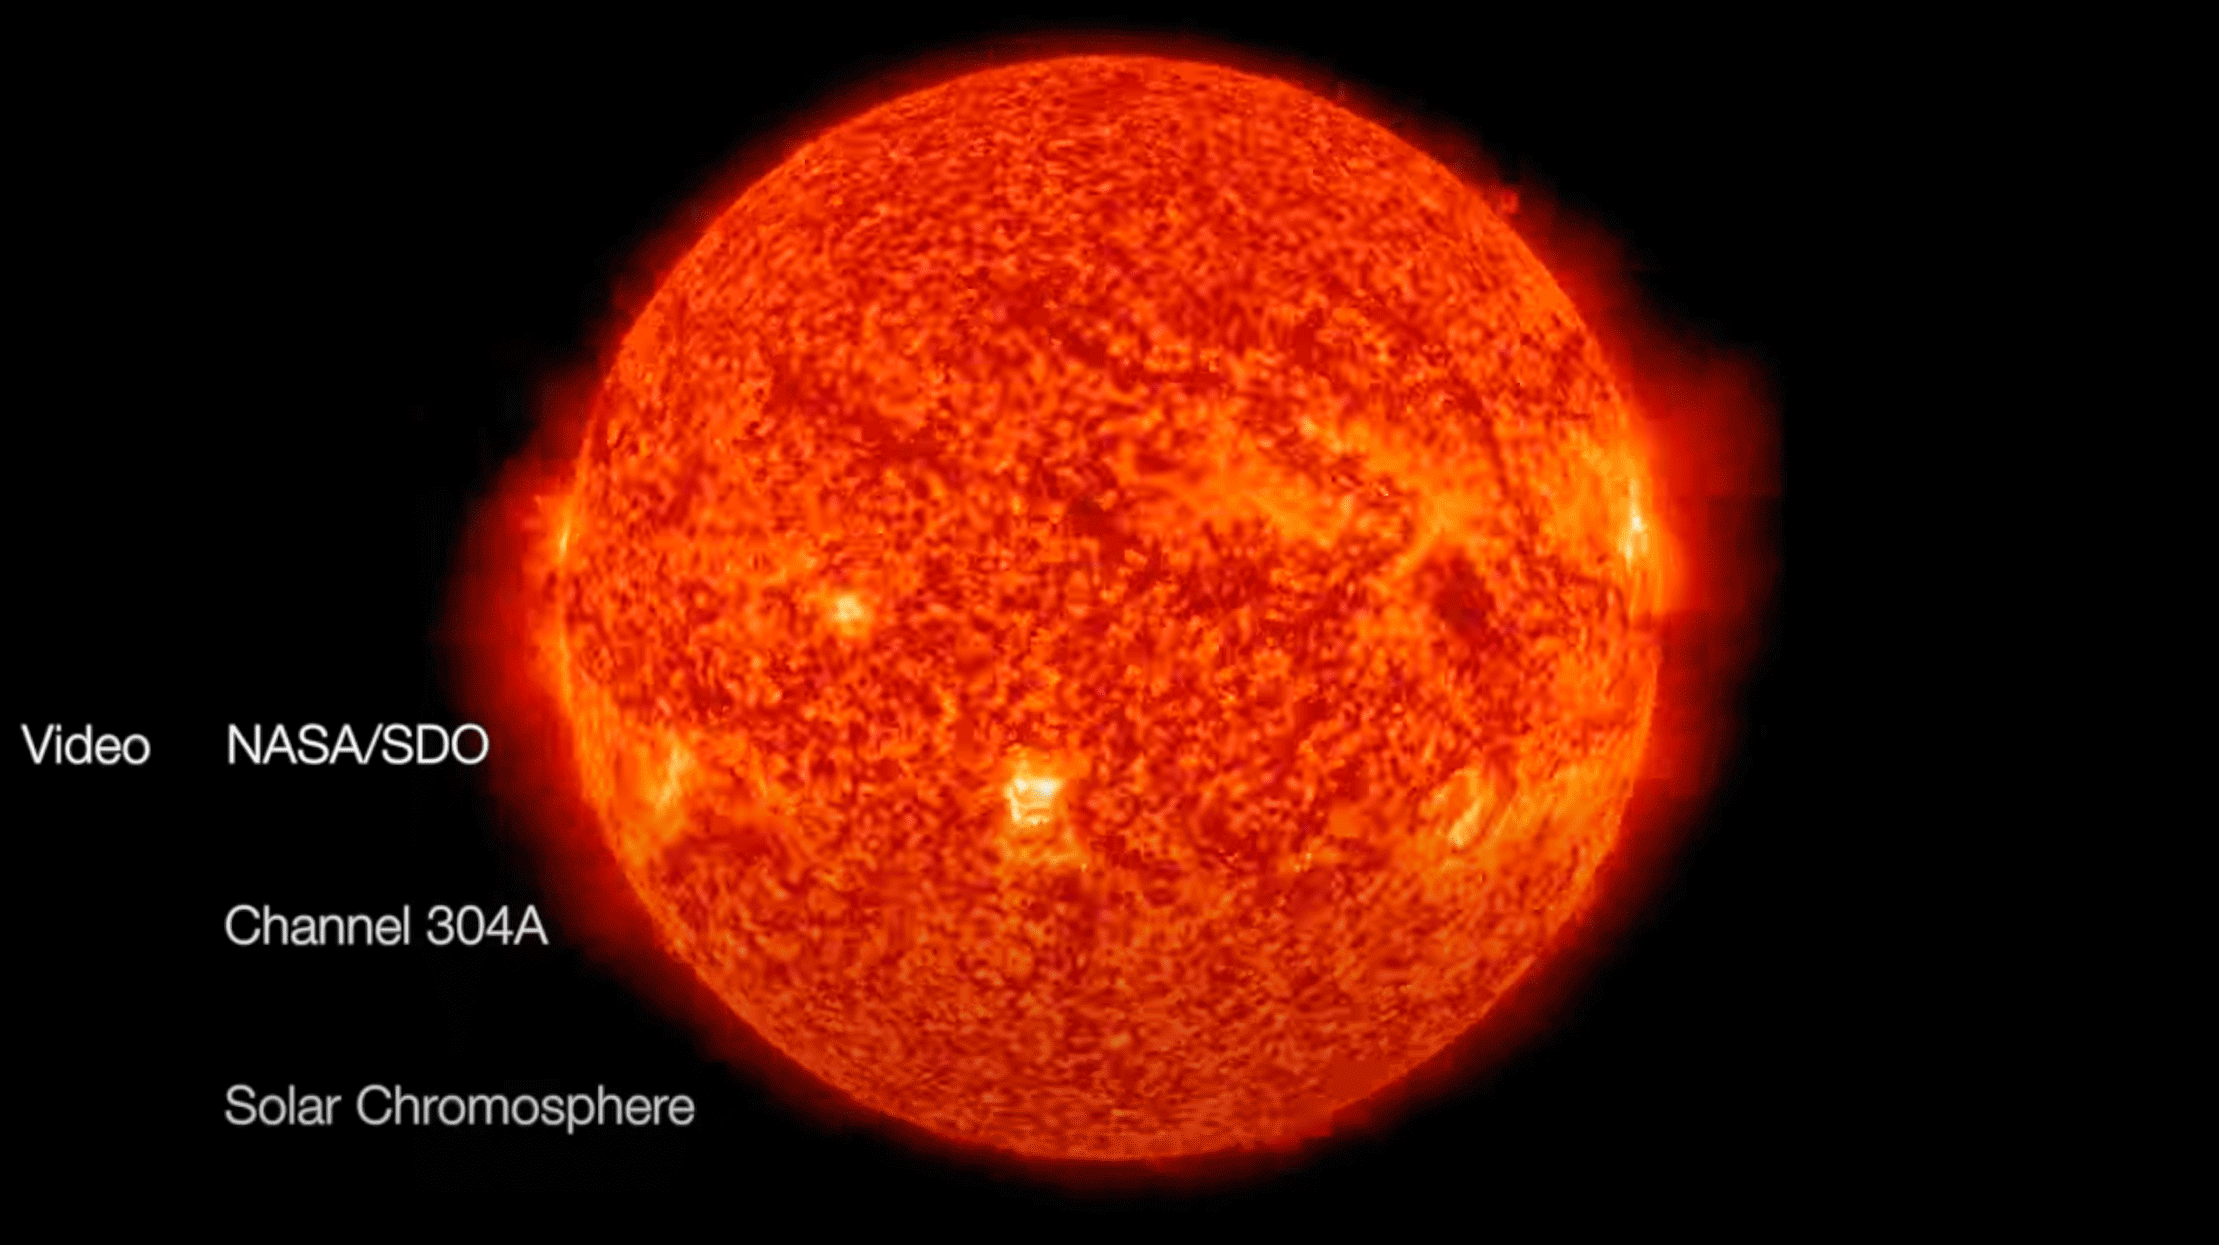
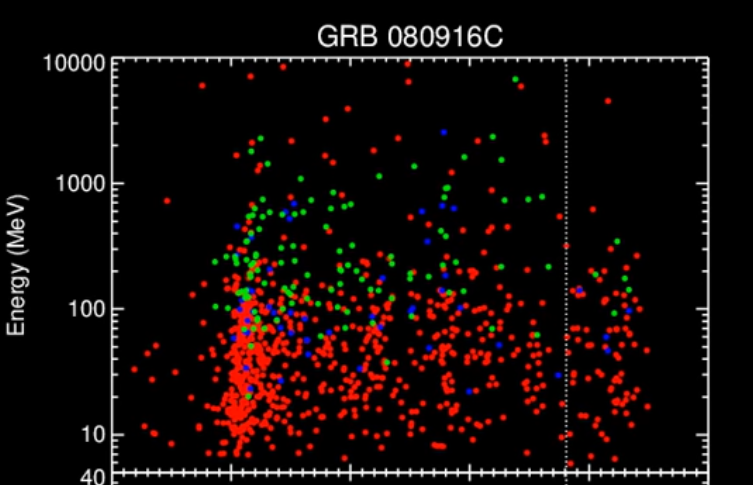
Learn about astronomical variables and transients like - black holes and supernova, quasars and pulsars - and experience videos of their sonified light curves and spectra.
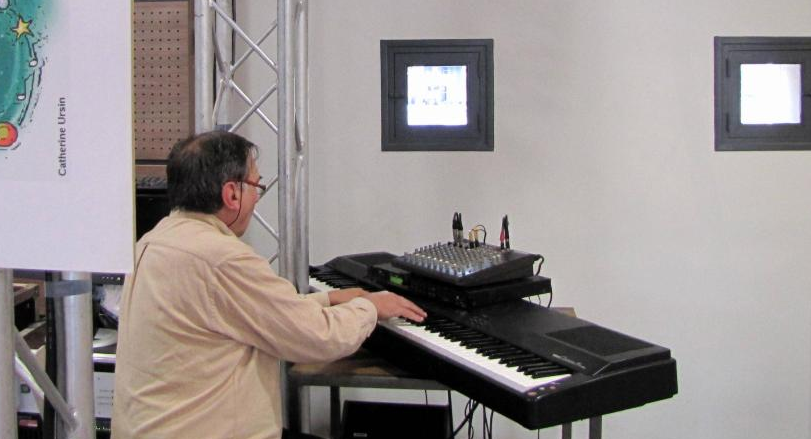
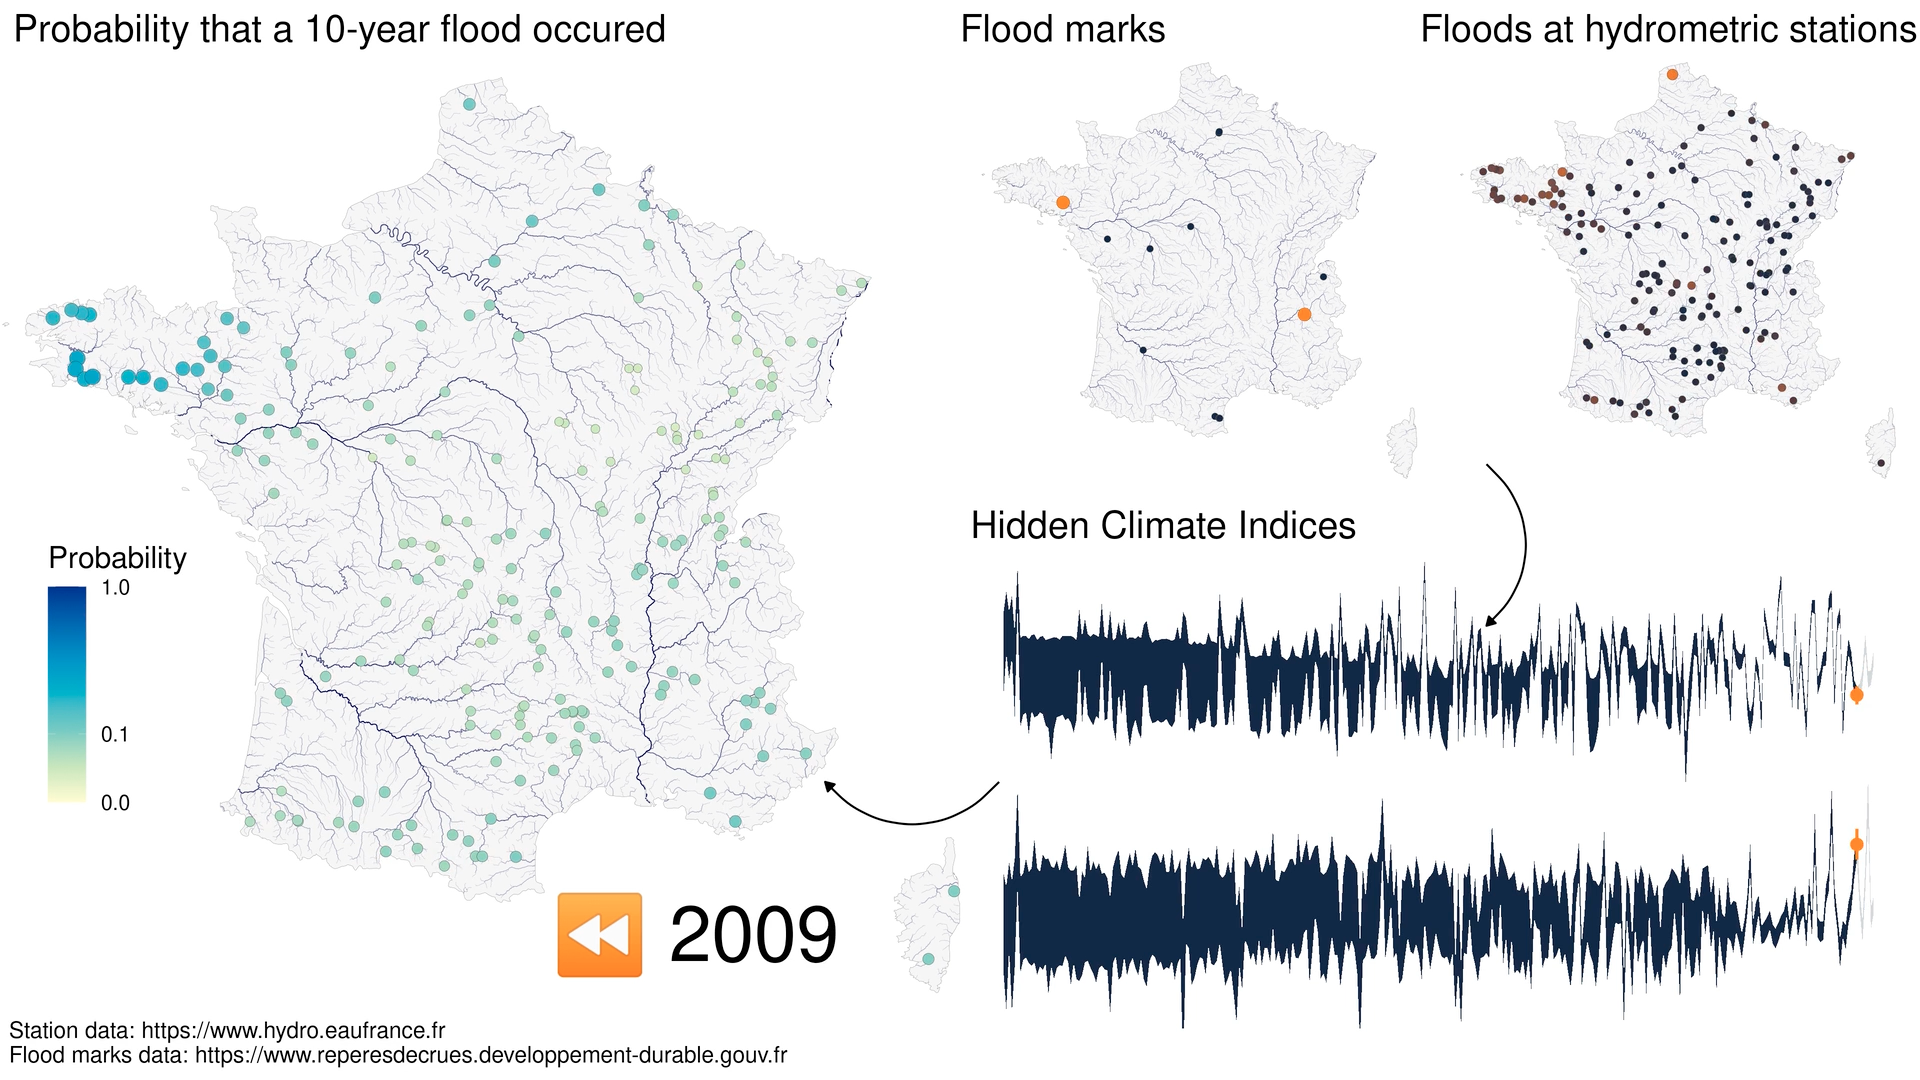
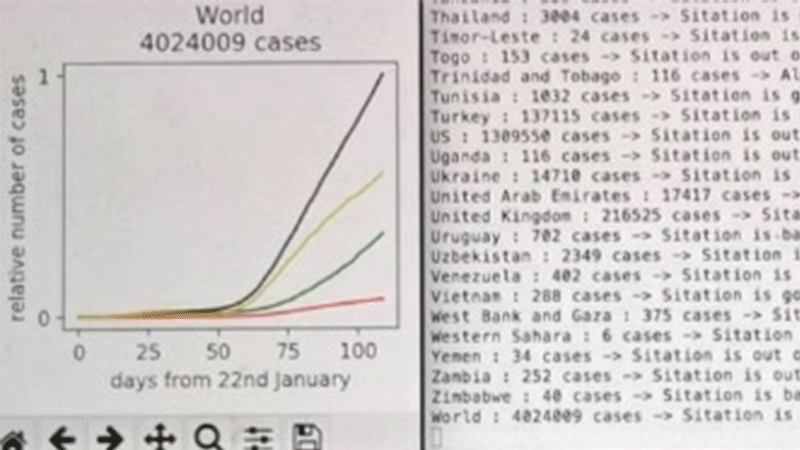
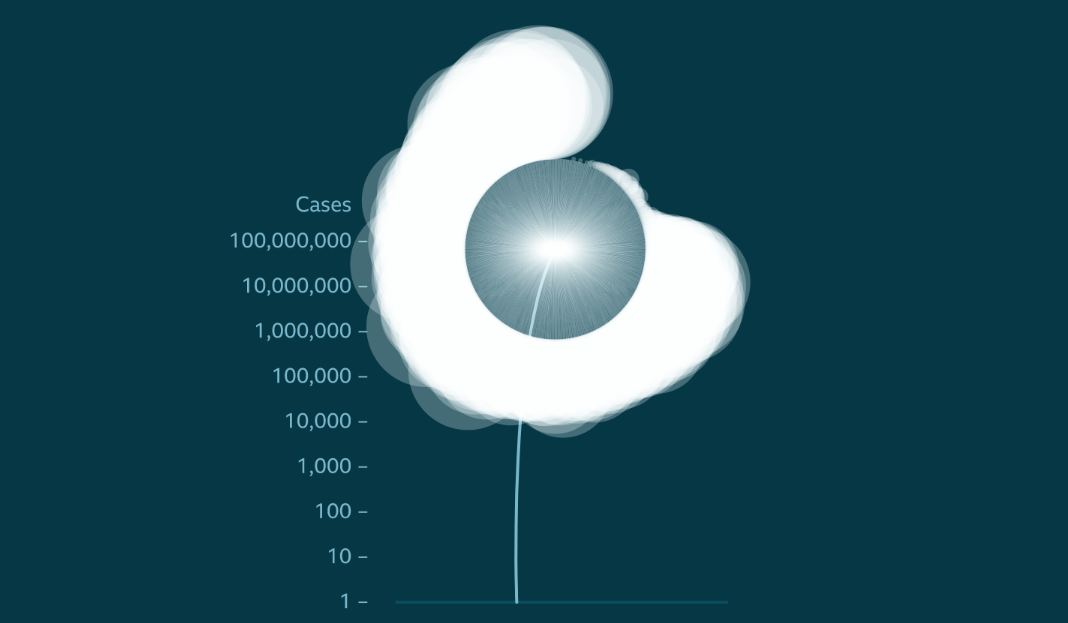
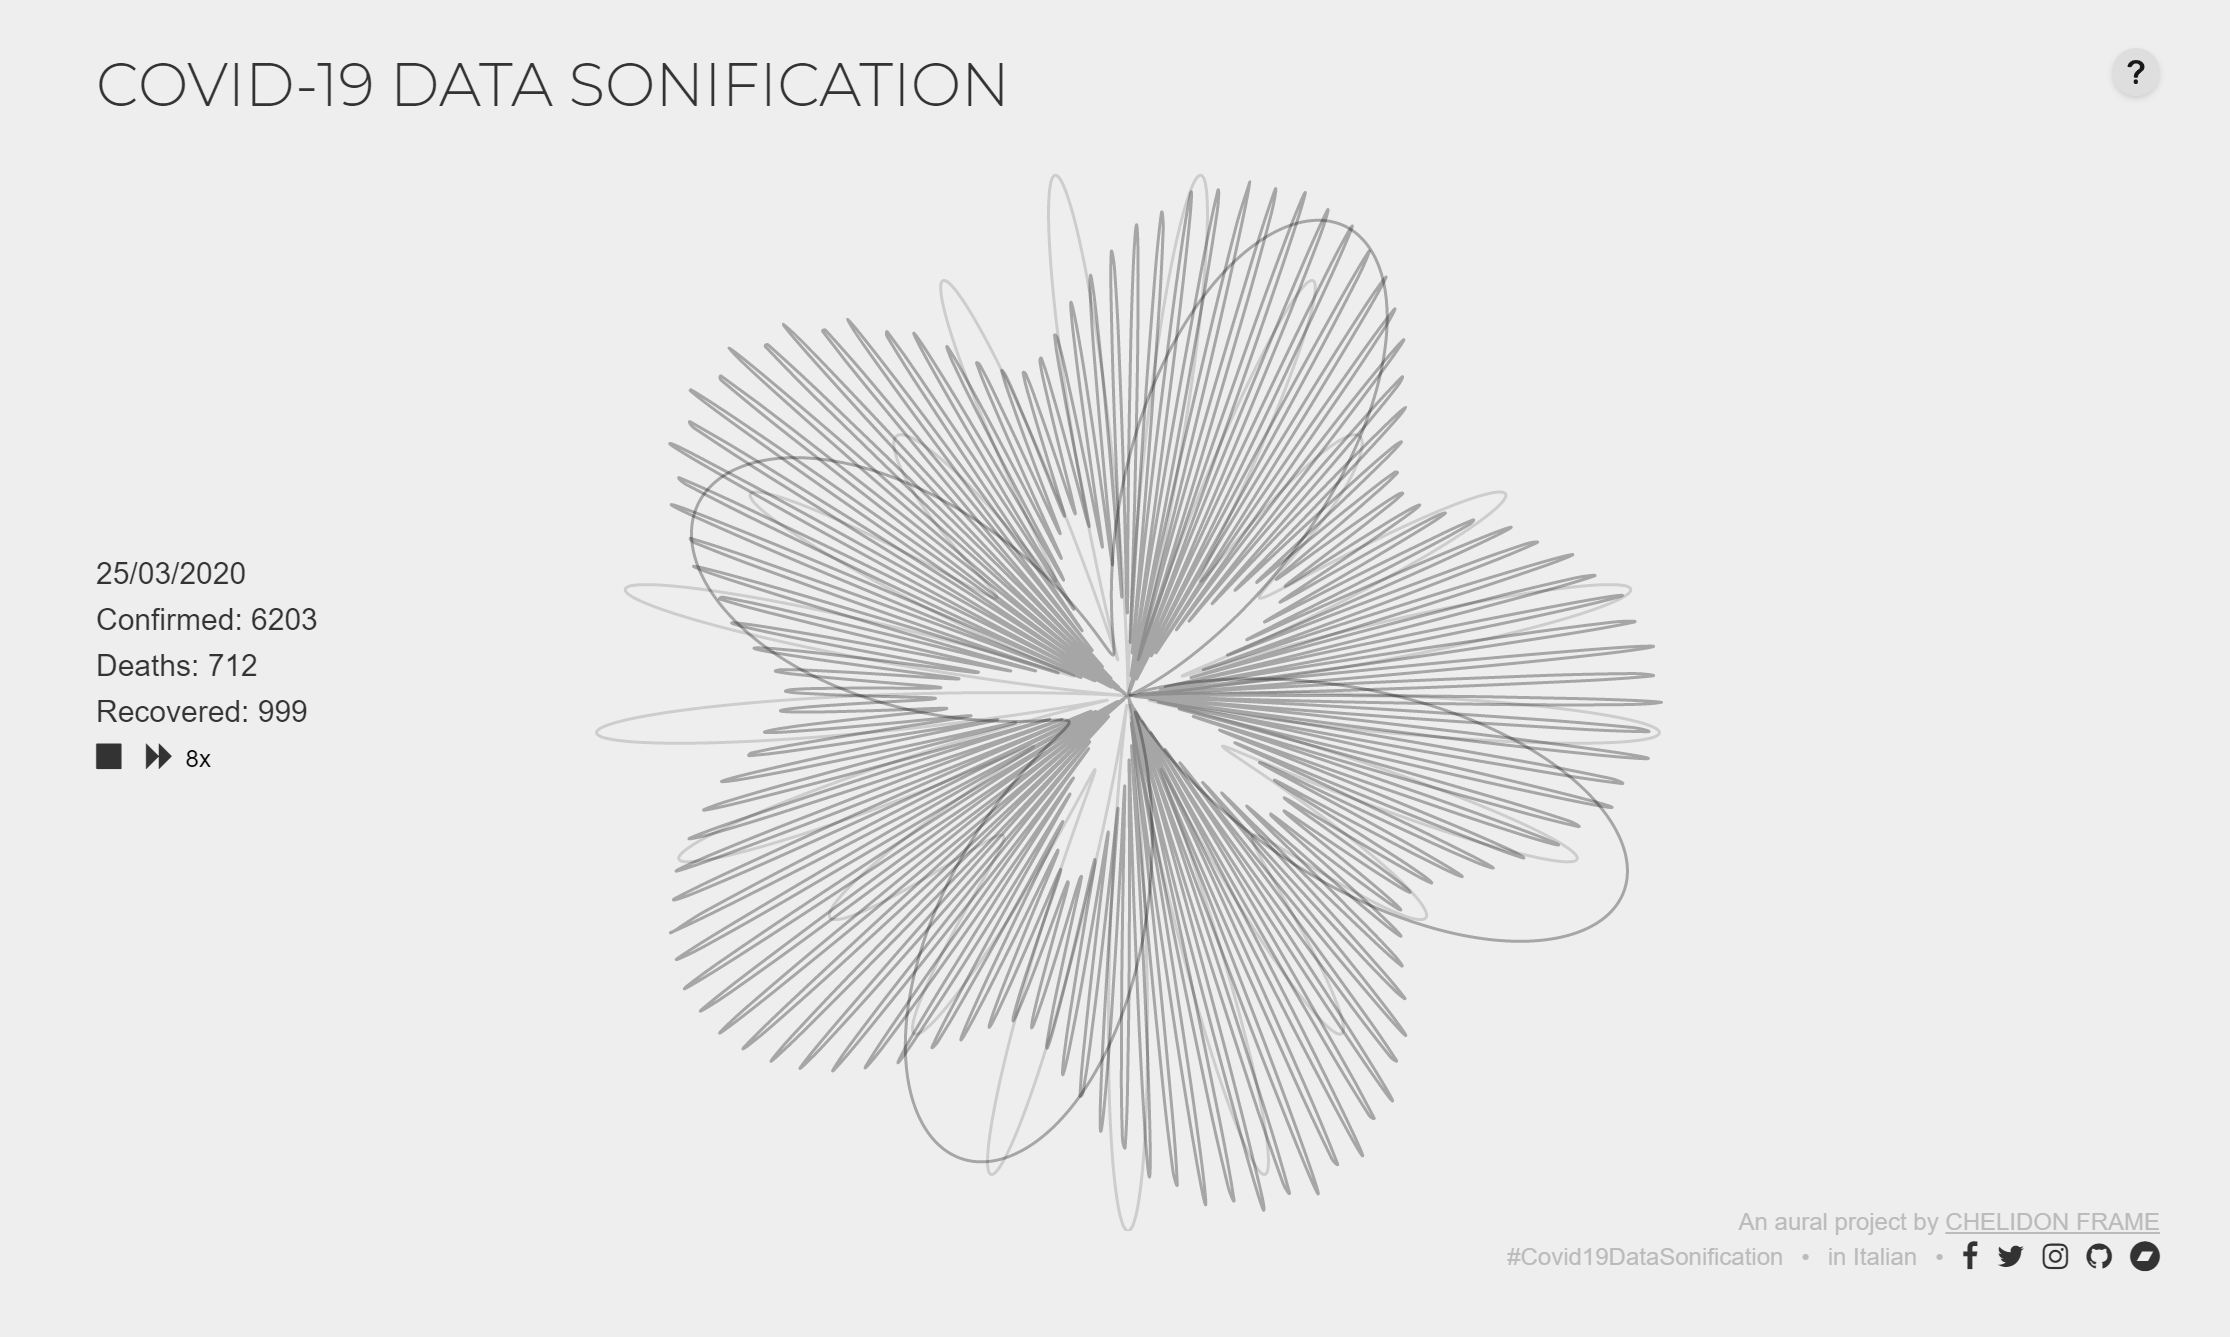
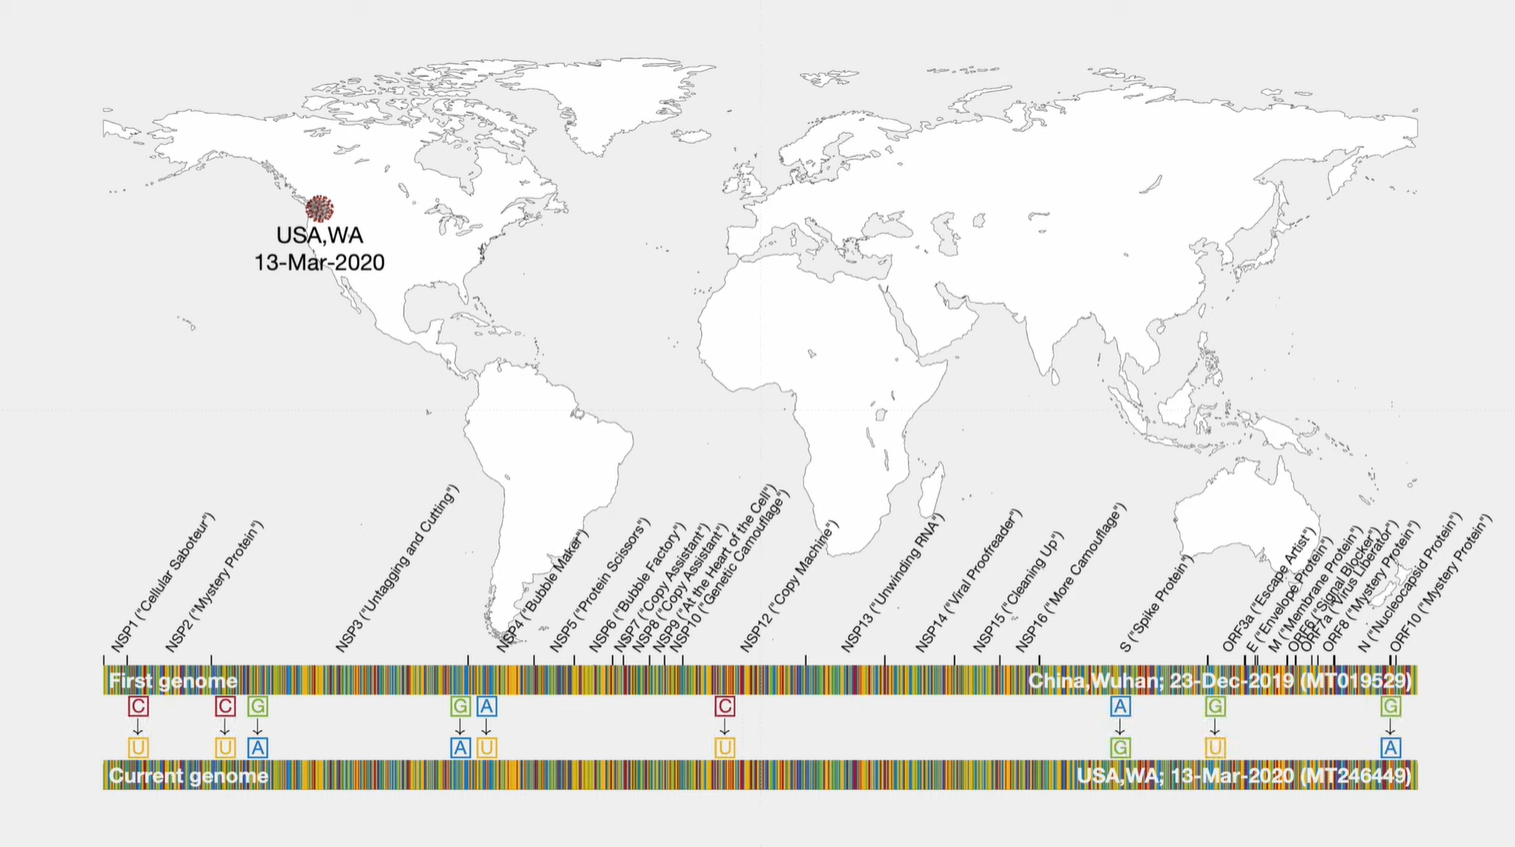
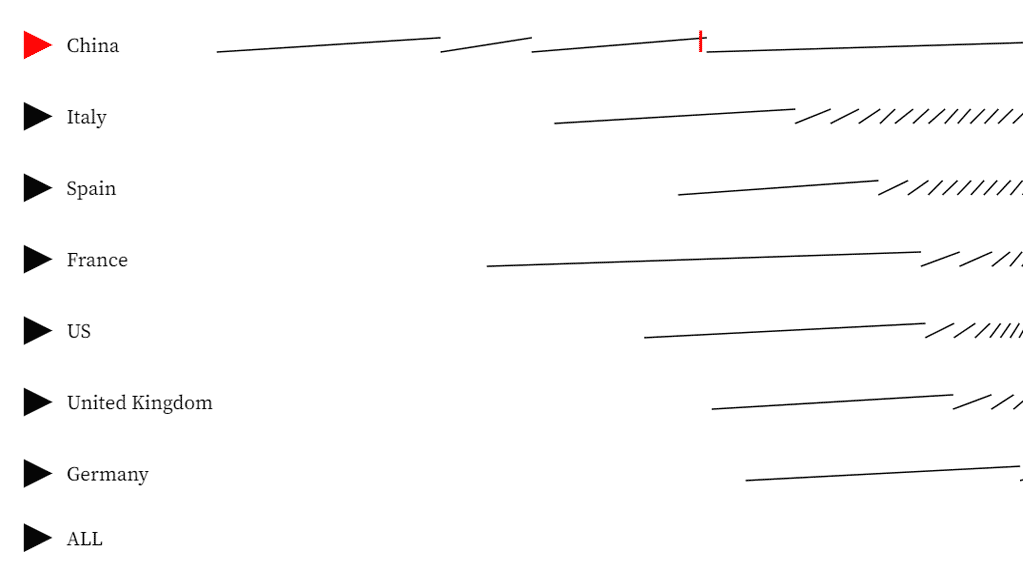
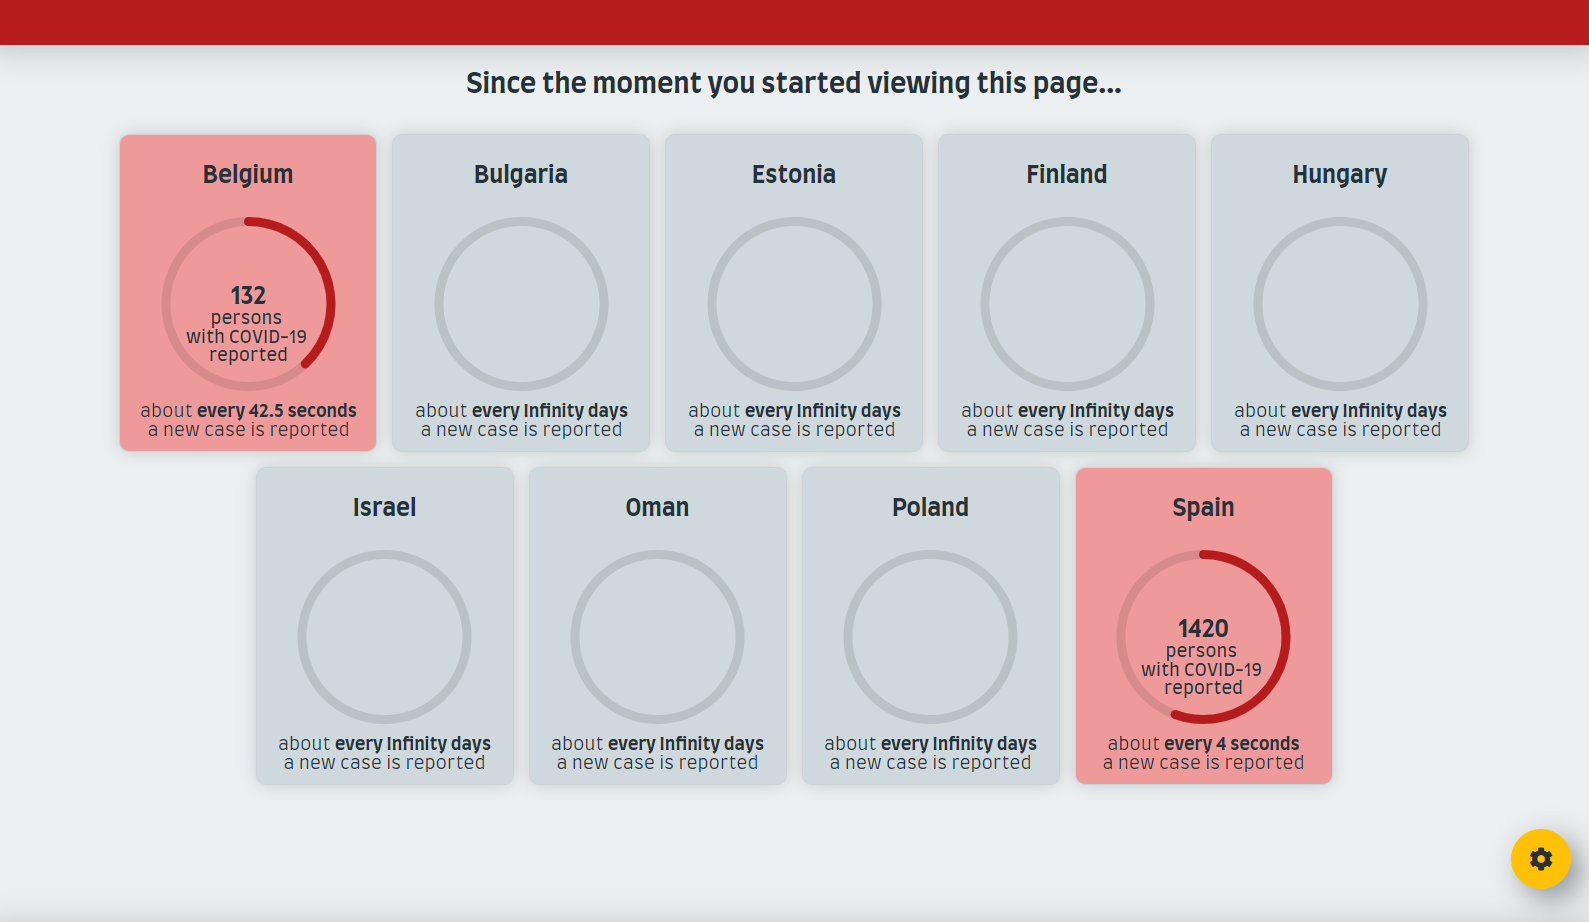
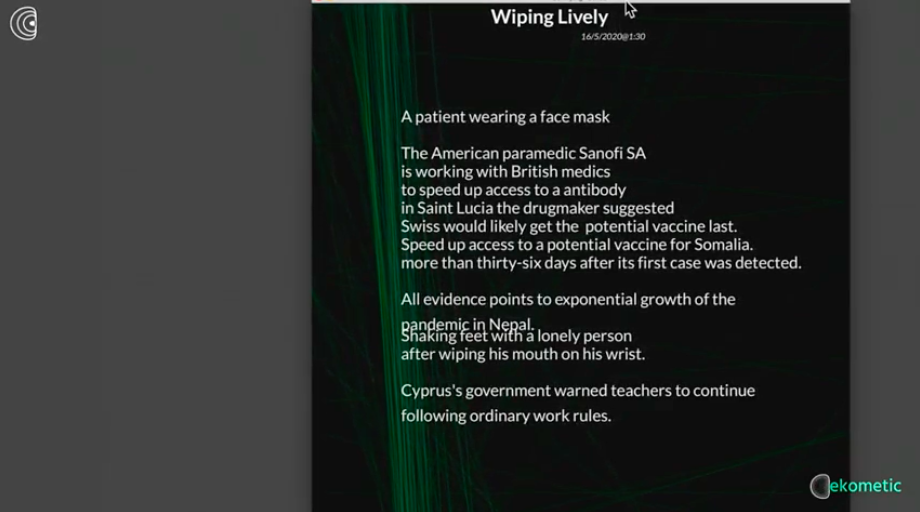
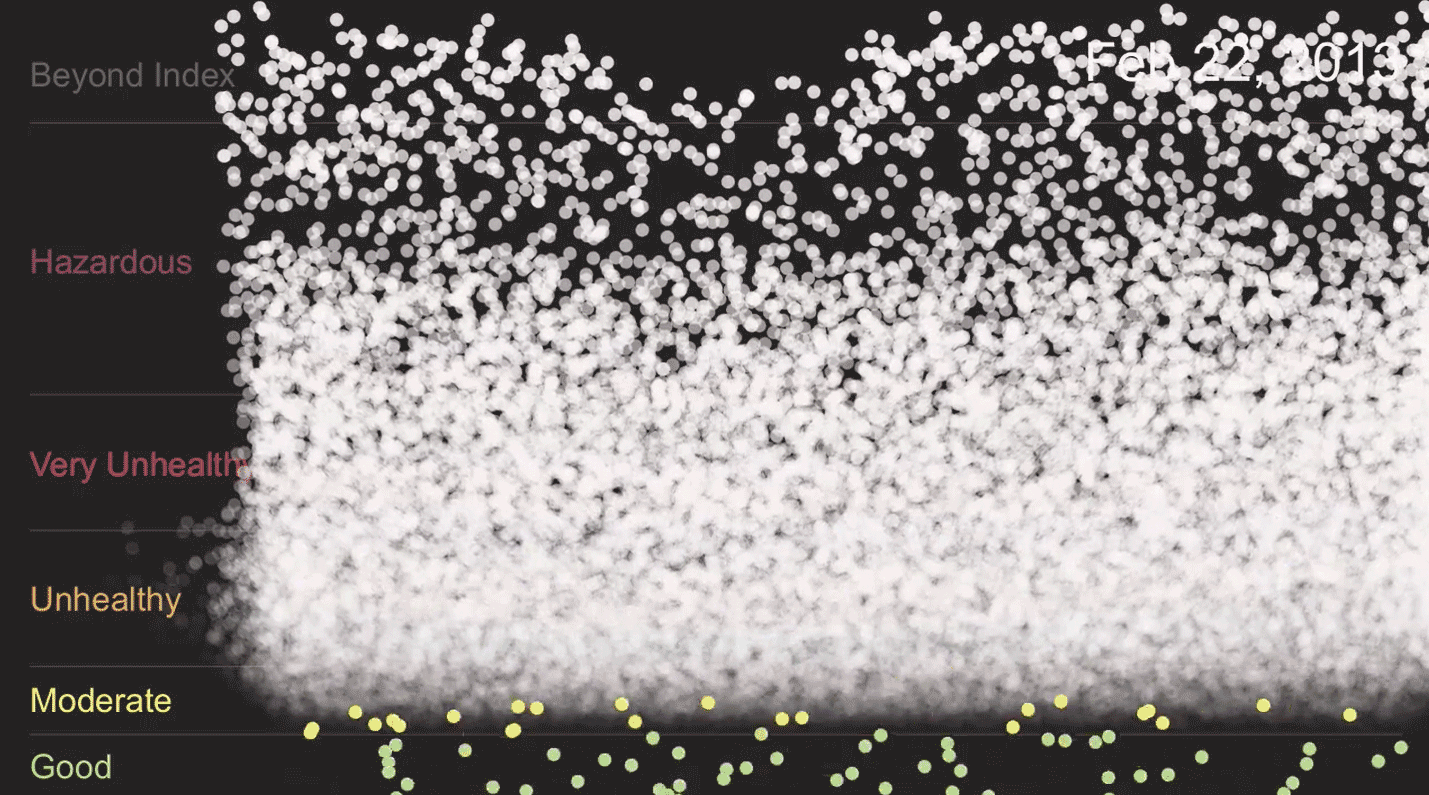
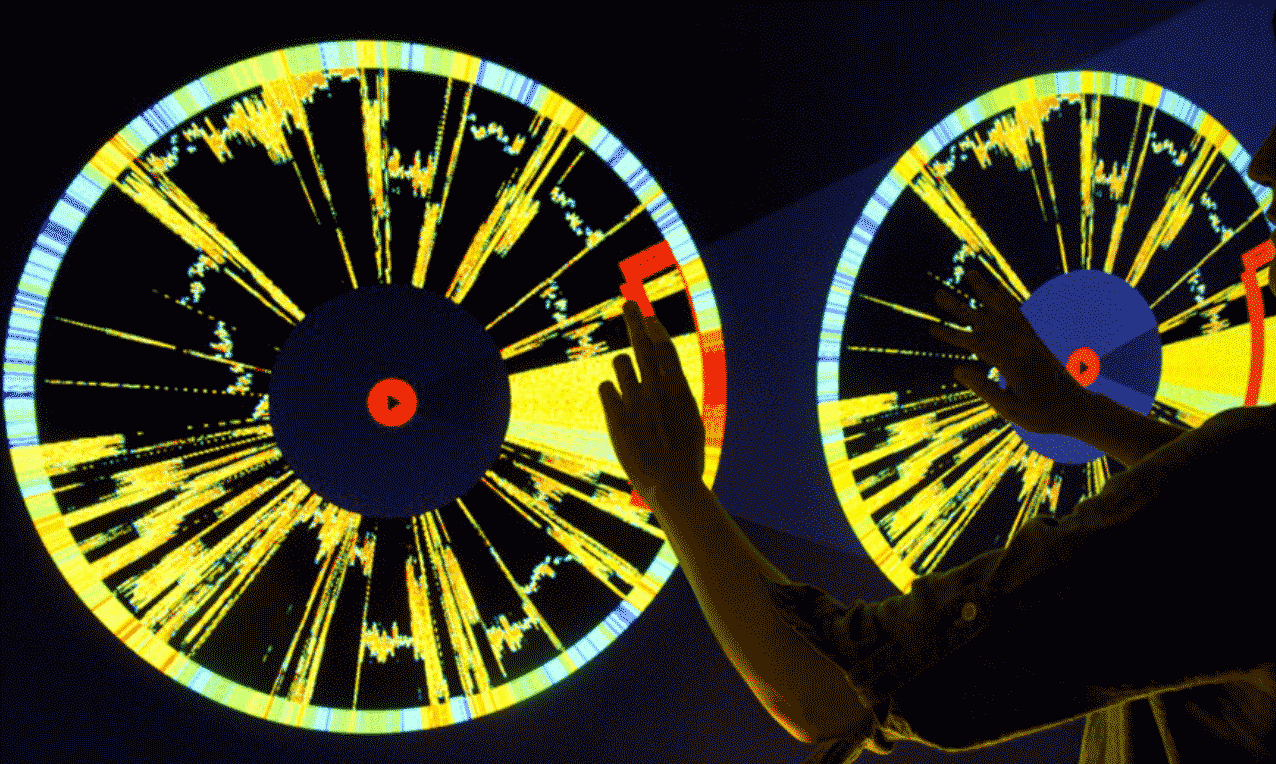
We collect Covid-19 pandemic data available on the web from which we extract information for each country, the number of active cases is deduced and displayed visually on a plot showing total cases, deaths and recoveries. We are interested in the shape of the active cases curve, informing on the pandemic situation of a given country. A bell shaped curve indicates a well controlled situation whereas some countries are only at the beginning of it.
The sounds generated from the active cases have a pitch and pulse depending on the total number of cases. The amplitude follows the active cases curve to give an indication of its shape with a panning suggesting a timeline. The bassline indicates the beginning of a reading and illustrates the relative number of deaths related to total cases
The accuracy of this dataset in respect to real situations is subject to available information and governmental policies. Every single country has its own way to identifying occurred Covid-19 cases and causes of death in their population.
please use headphones for best hearing experience
Covid-19 Pandemic Reader
sonification by Daniel Maszkowicz
SZKMD production
COVID-19 Data Repository by the Center for Systems Science and Engineering (CSSE) at Johns Hopkins University
first upload – 15th May 2020
second upgrade – 16th June 2020
third upgrade – 16th July 2020
fourth upgrade – 22nd August 2020
fifth upgrade – 17th October 2020
Last upgrade for One-Year Yubileum 22 January 2020- 21 January 2021
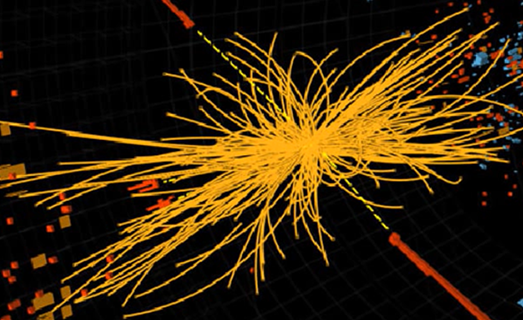
LISA for 3 string quintets, lights, and electronics
Panagiotis Botzios
| 2021
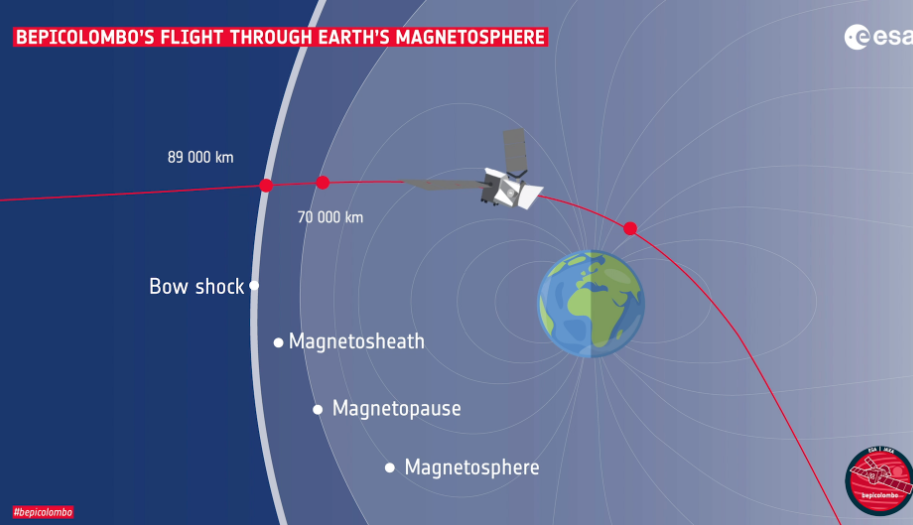
"LISA" is a composition by Greek composer Panagiotis Botzios, featuring data sonification techniques in collaboration with astrophysicist Valeria Korol. Inspired by gravitational waves and the L.I.S.A space mission by ESA, the piece translates the 3 satellites coordinates, gravitational wave simulation signals, and mission phases into a multisensory artistic experience, including sound, lights, and subwoofer vibrations. The composition was performed in 2021 at the Music University of Lübeck, showcasing a unique fusion of scientific data and artistry. The piece underwent a revision in 2023
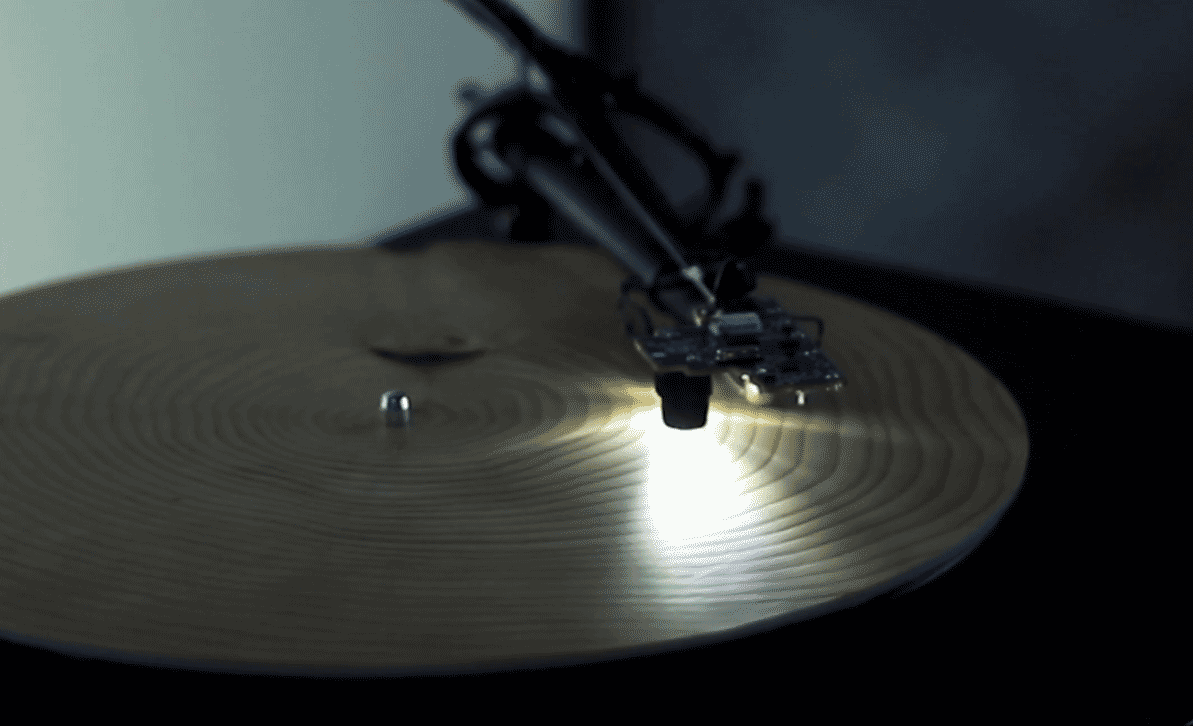
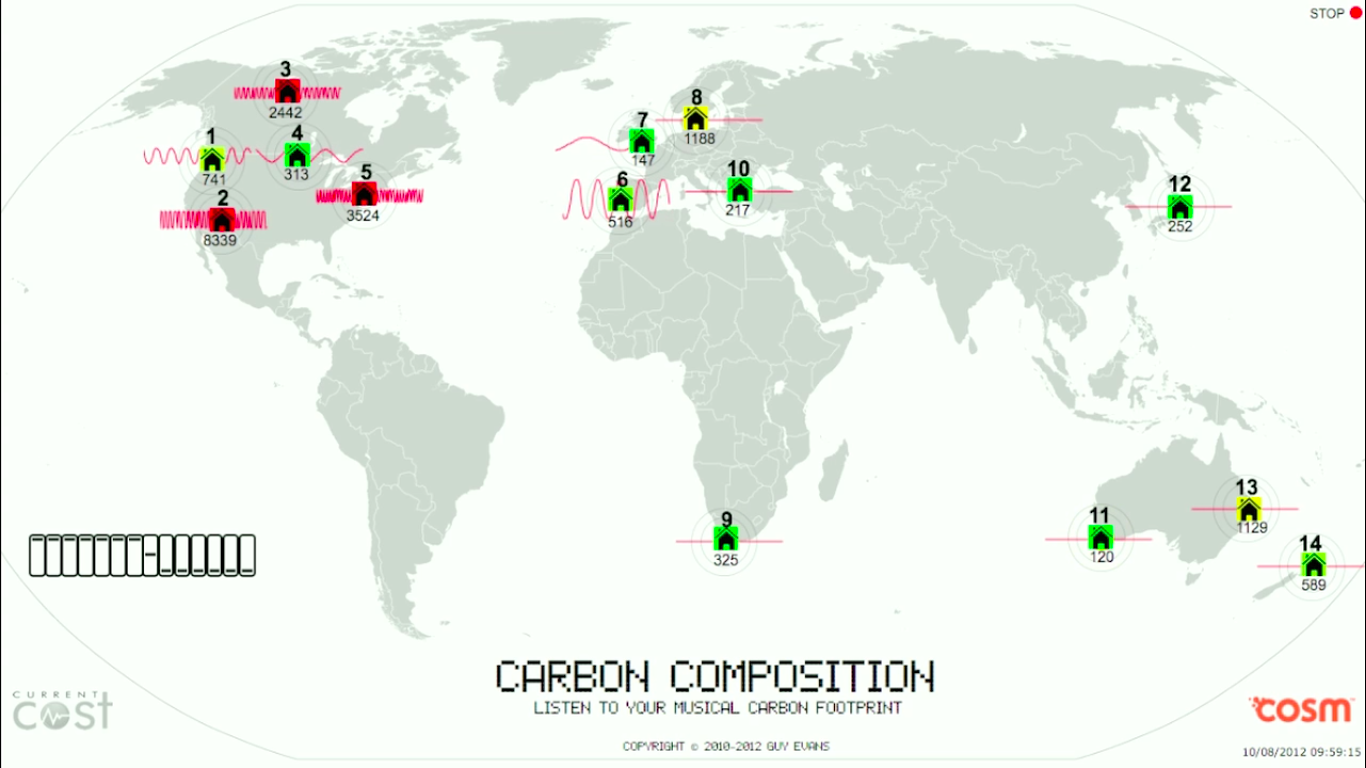
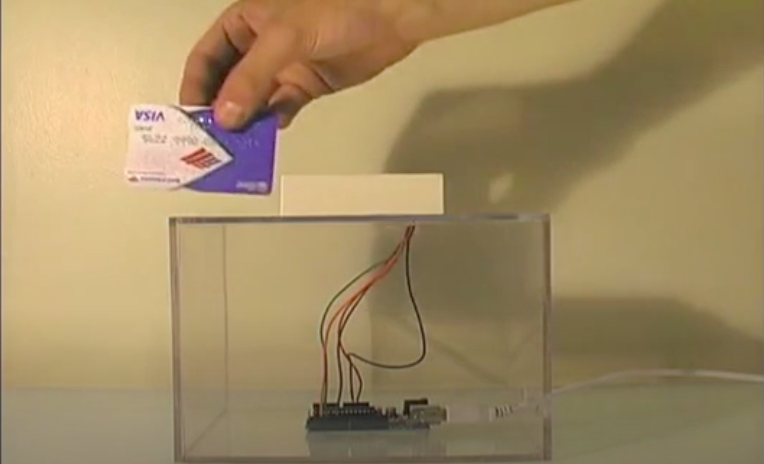
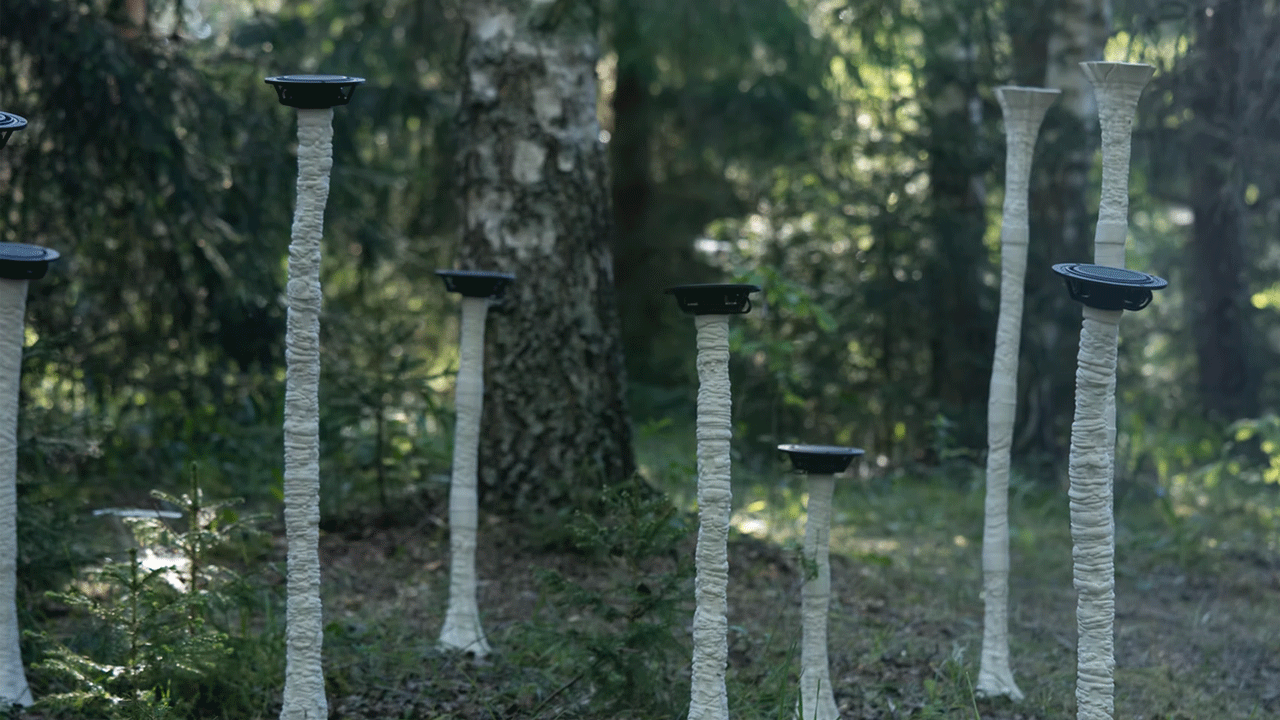
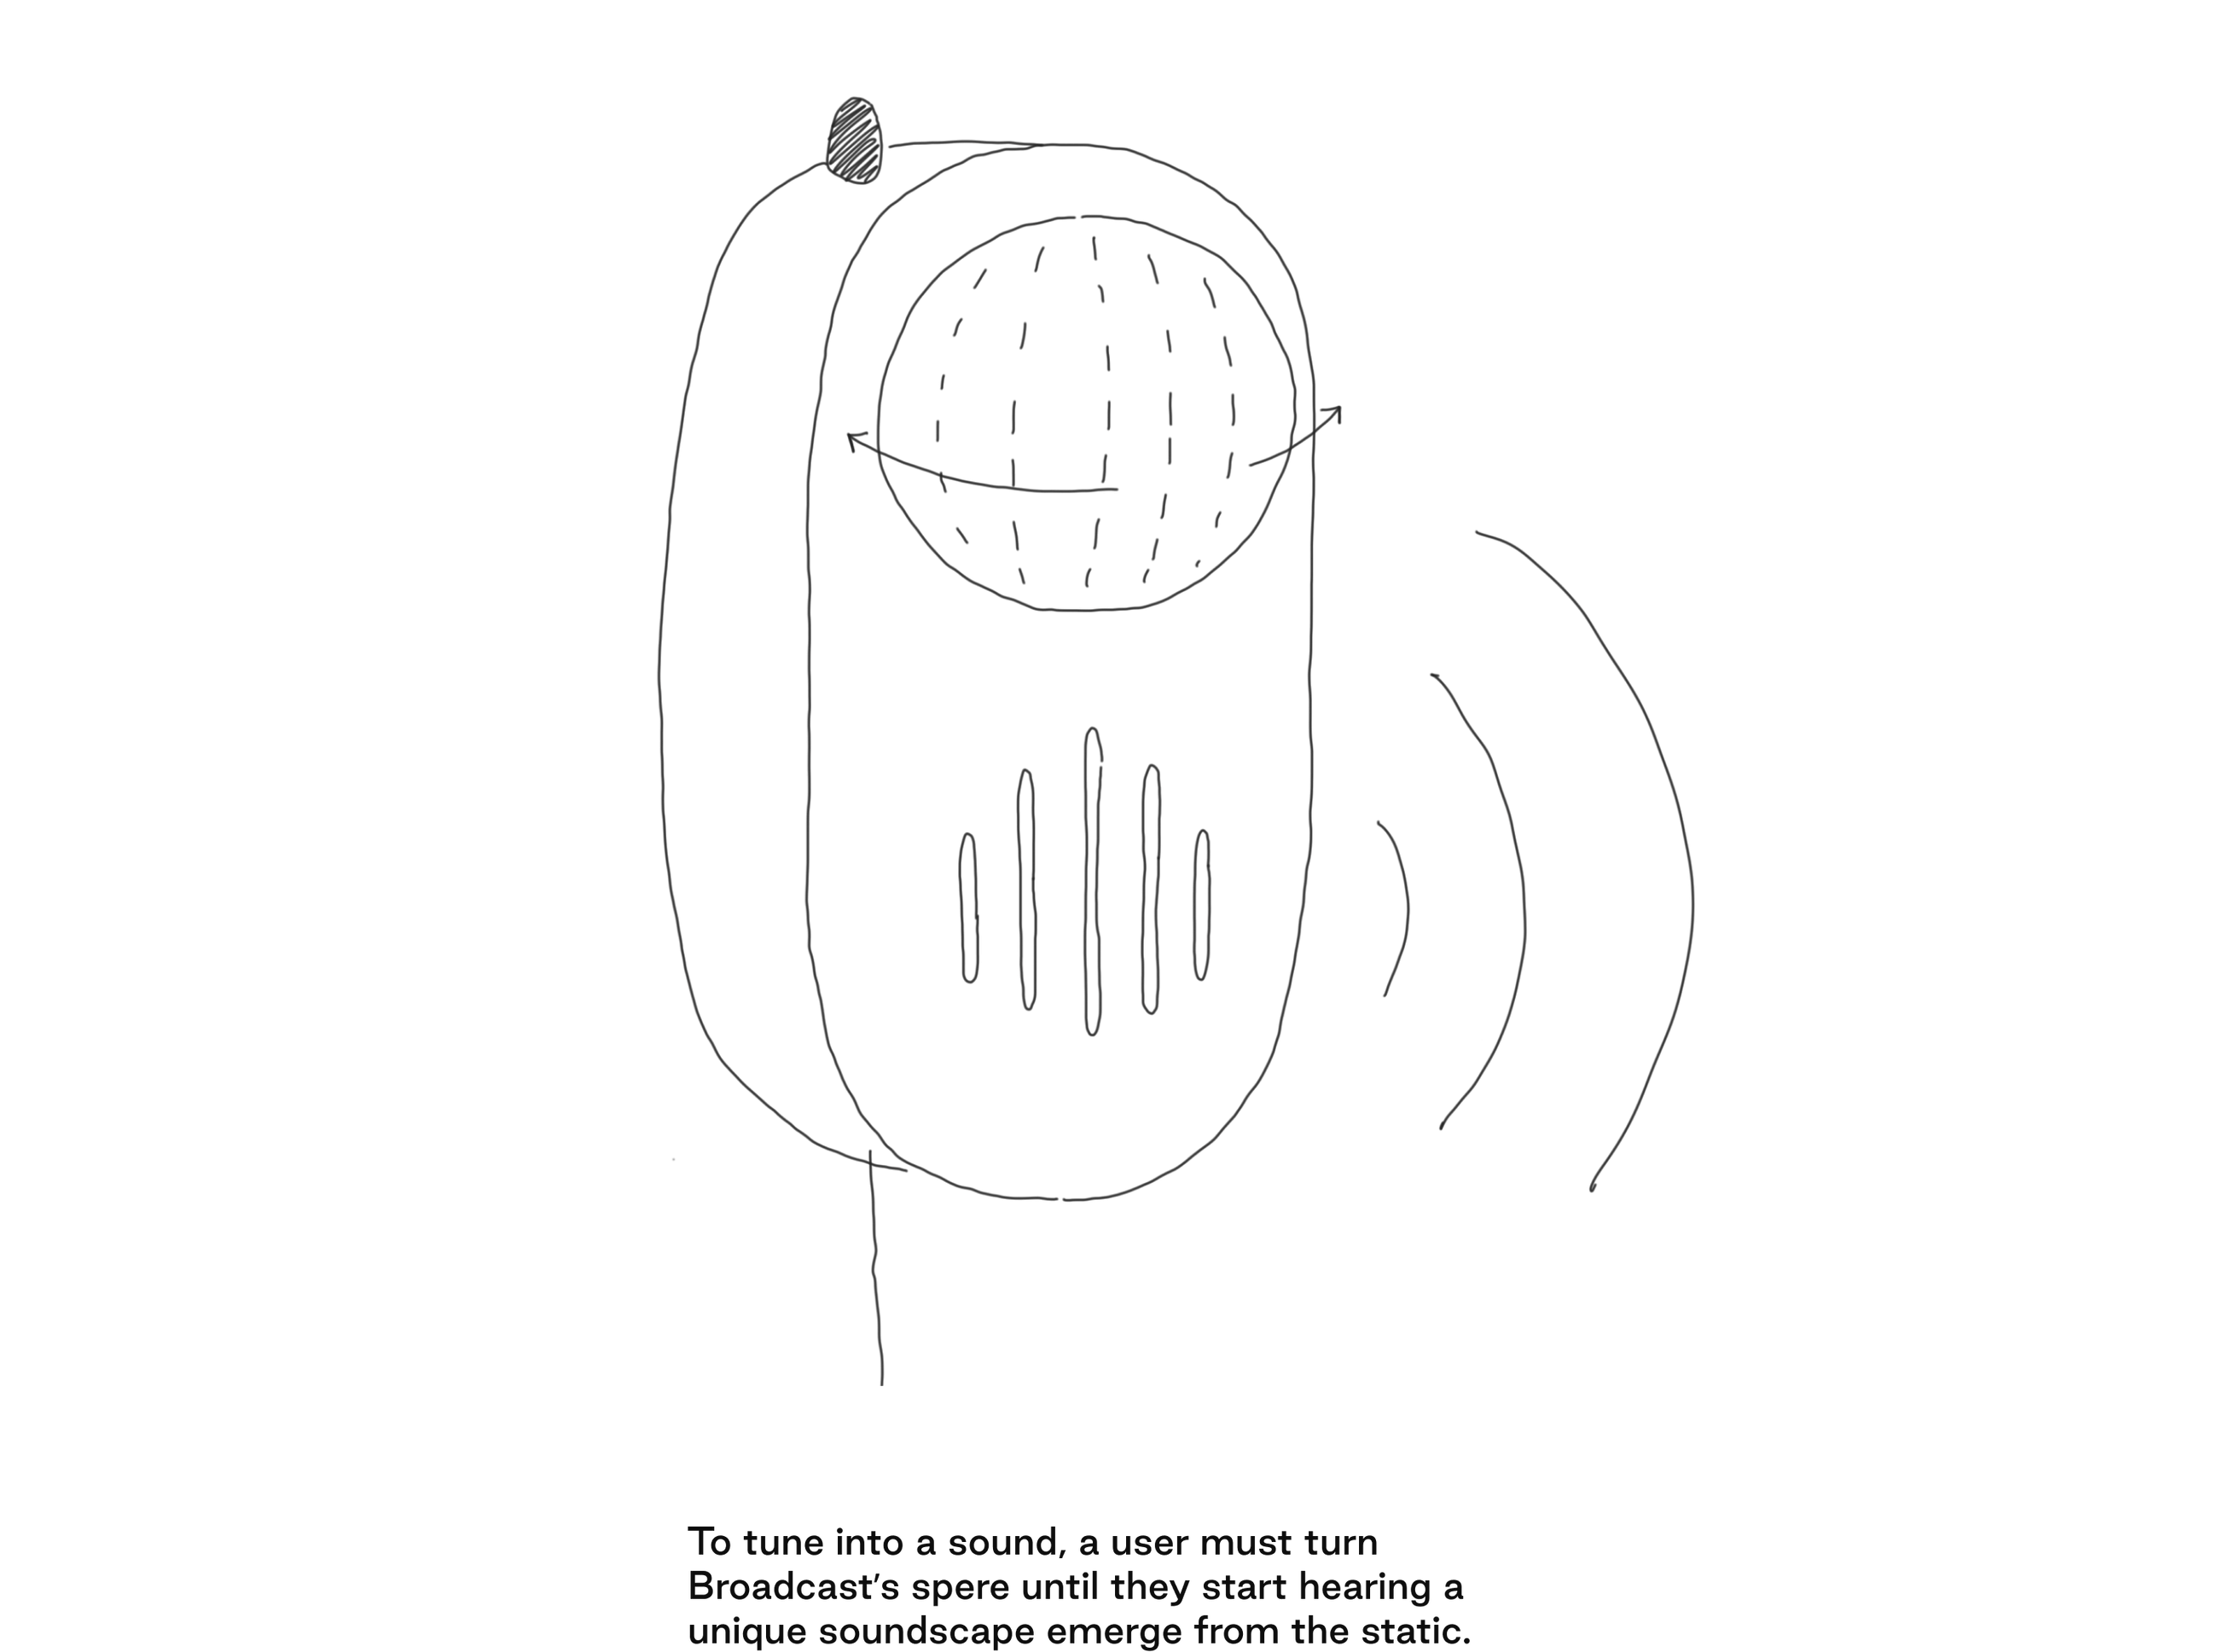
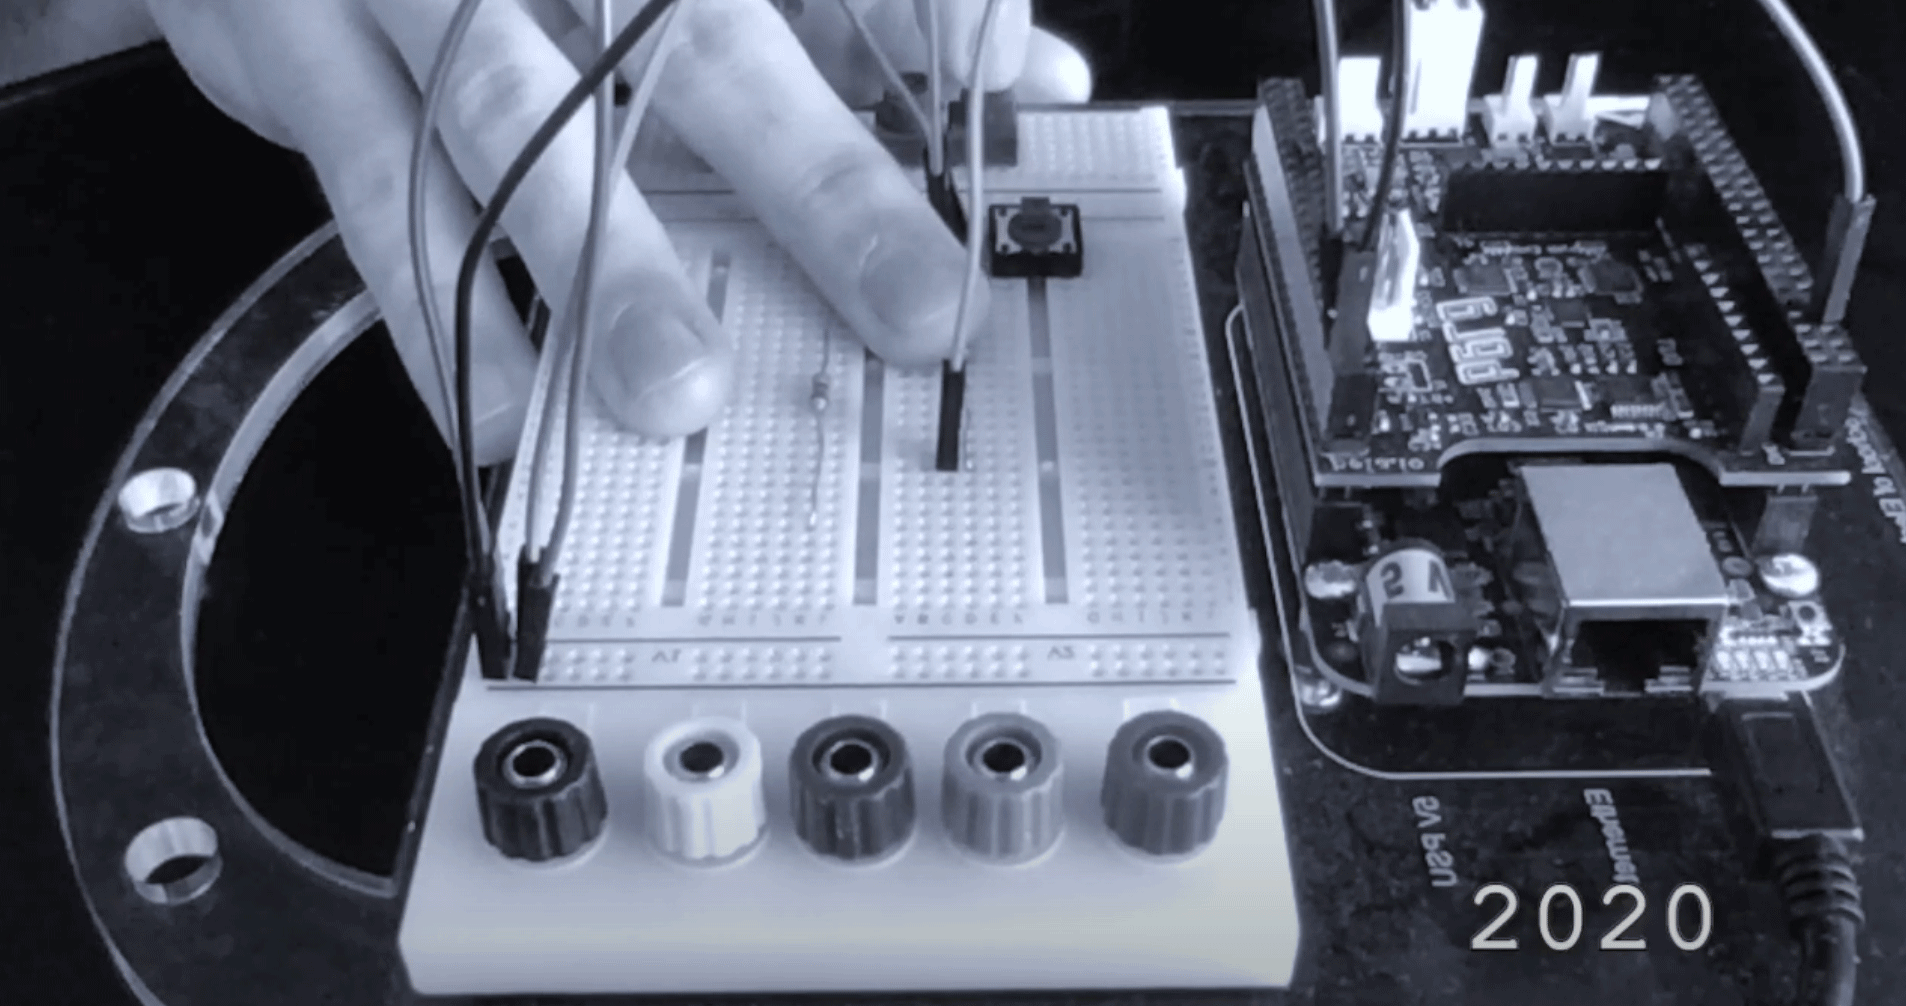
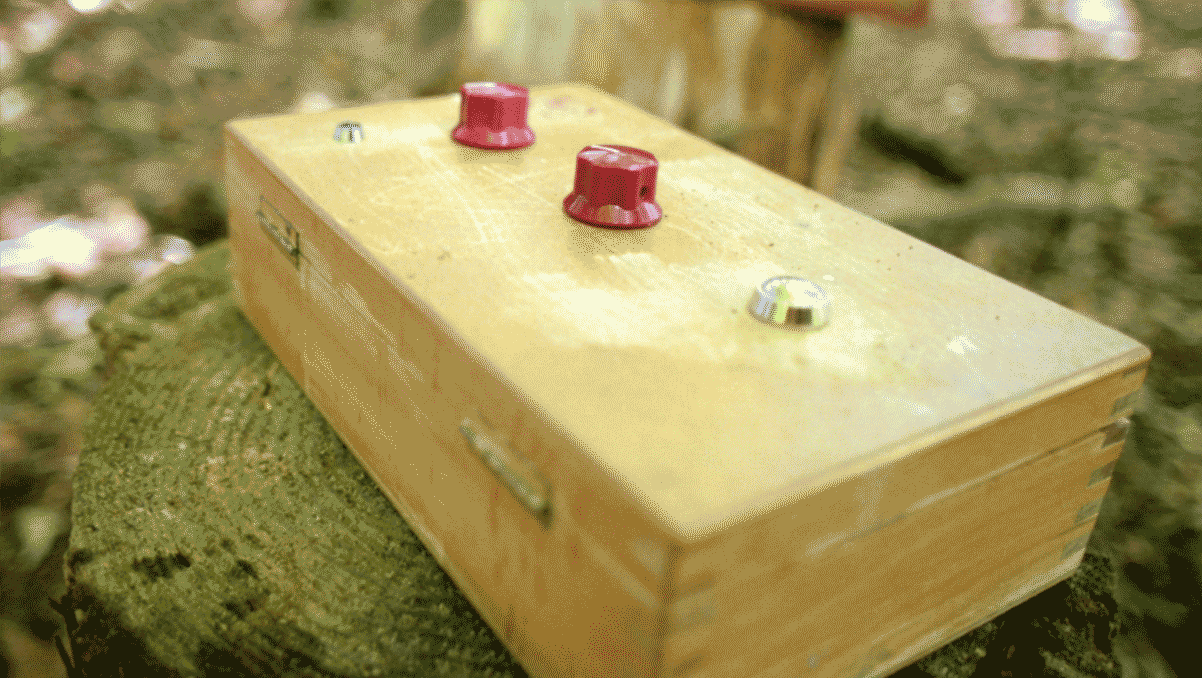
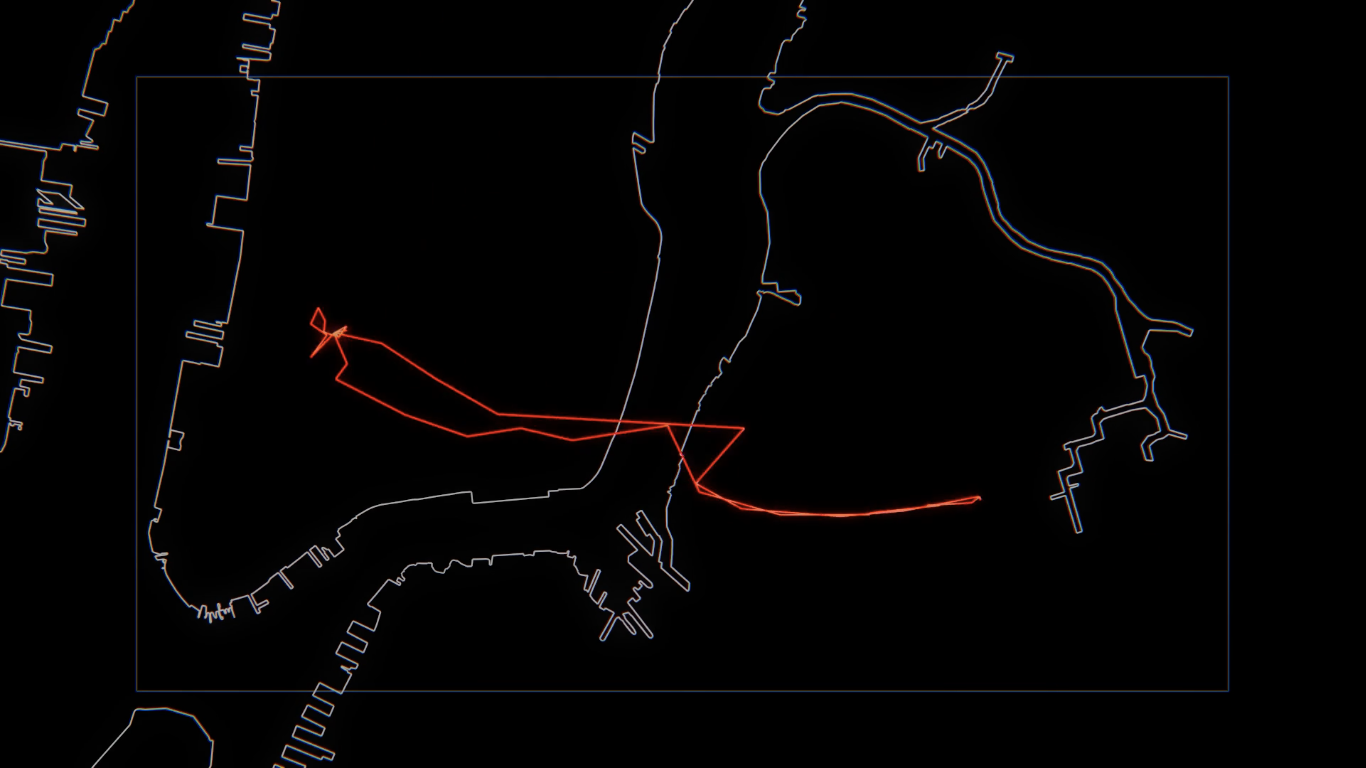
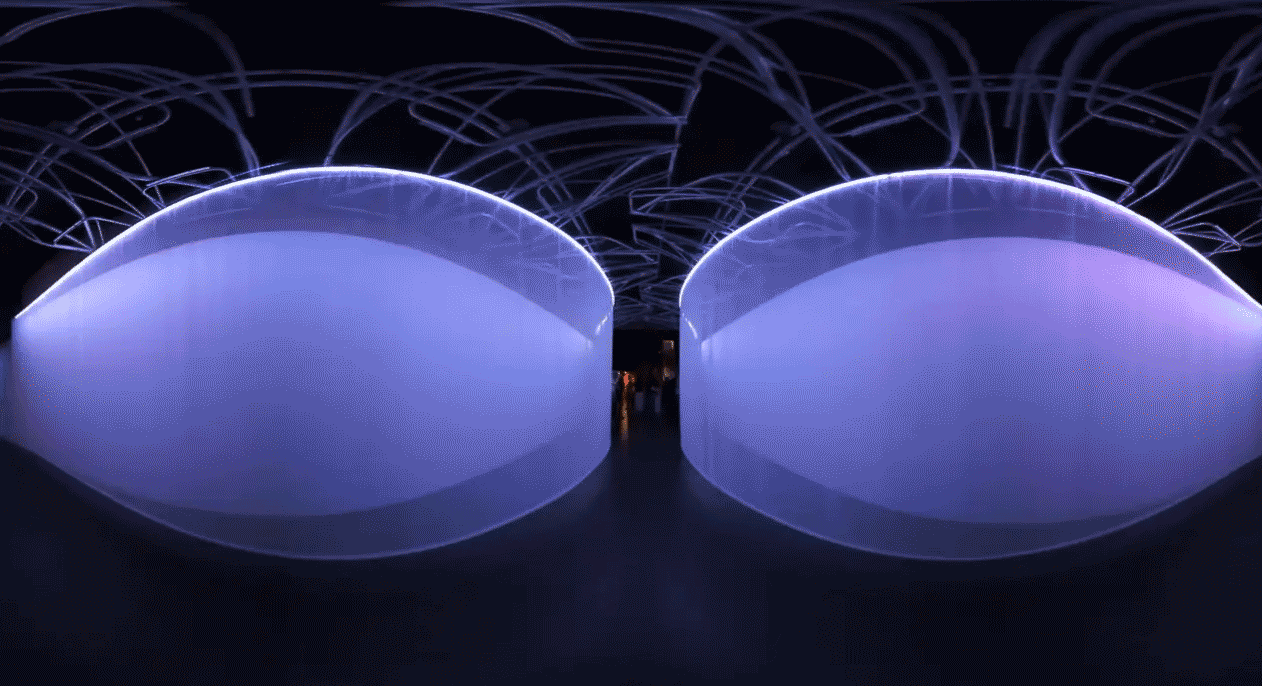
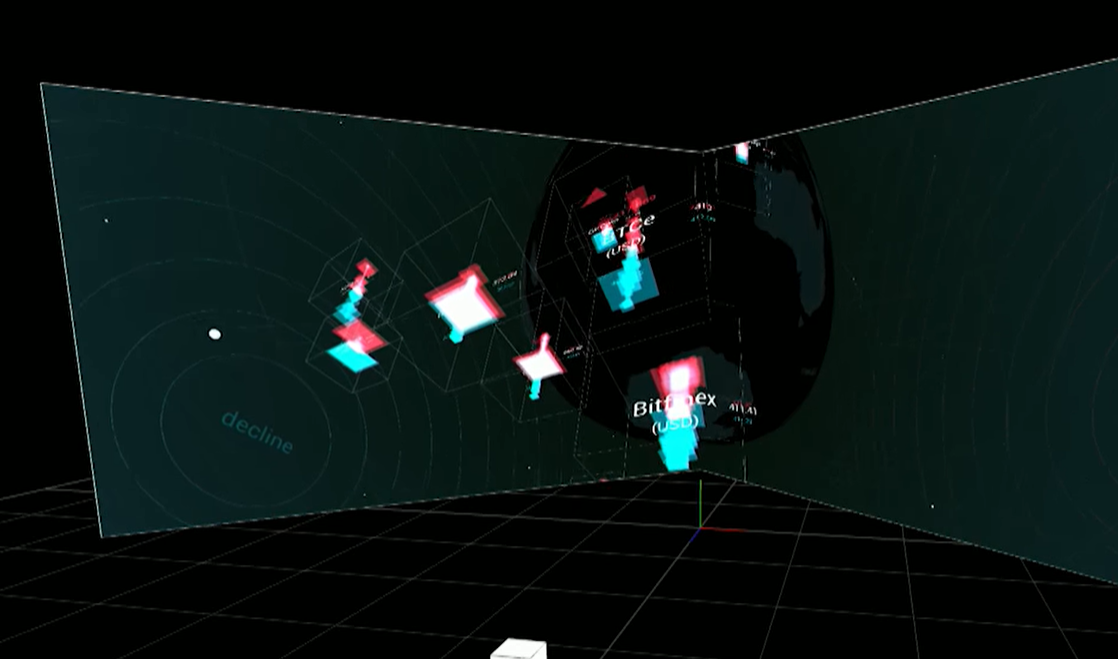
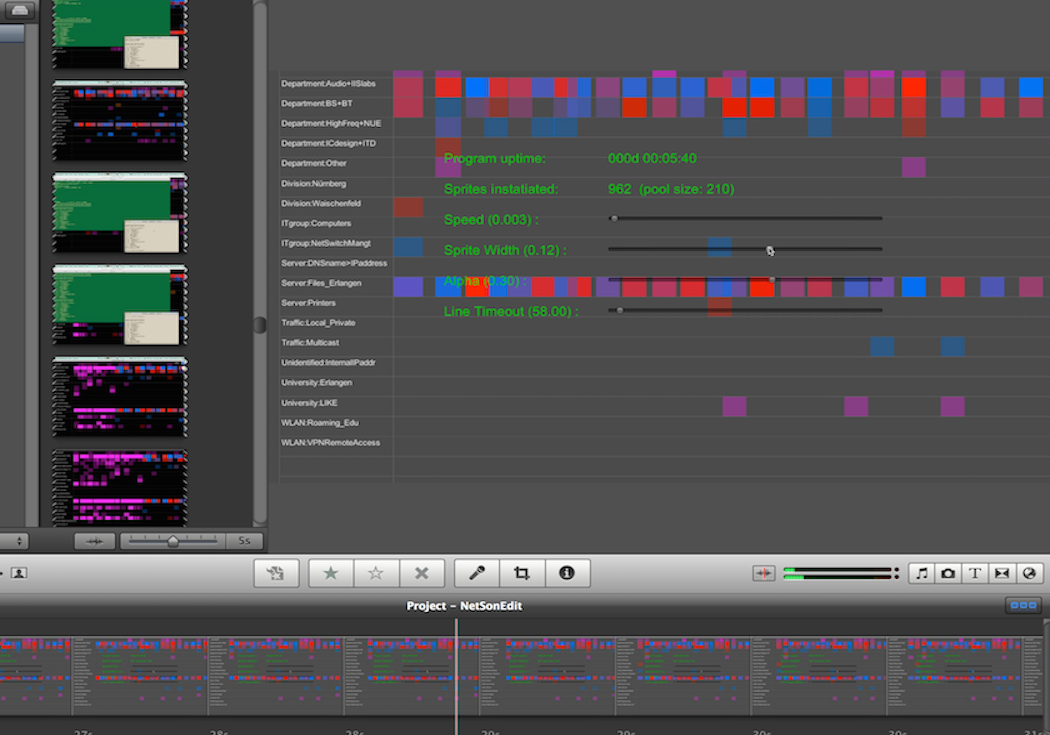
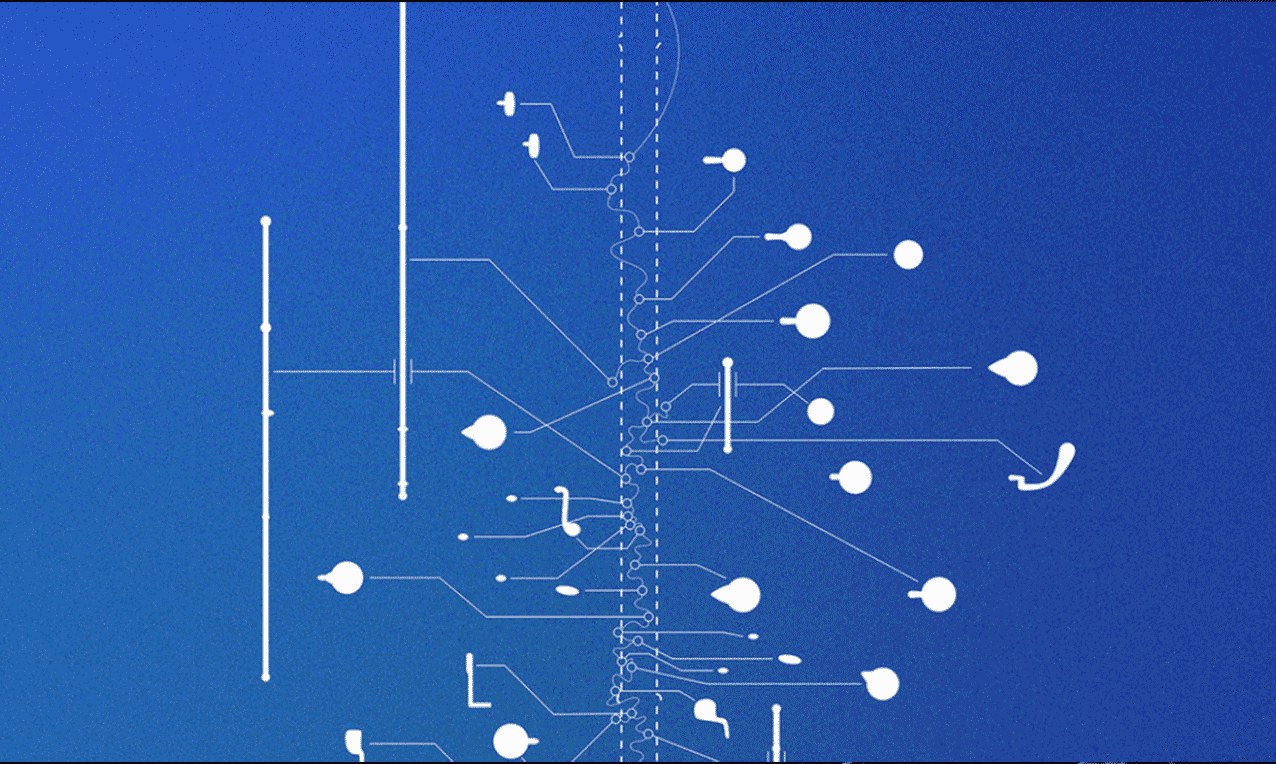
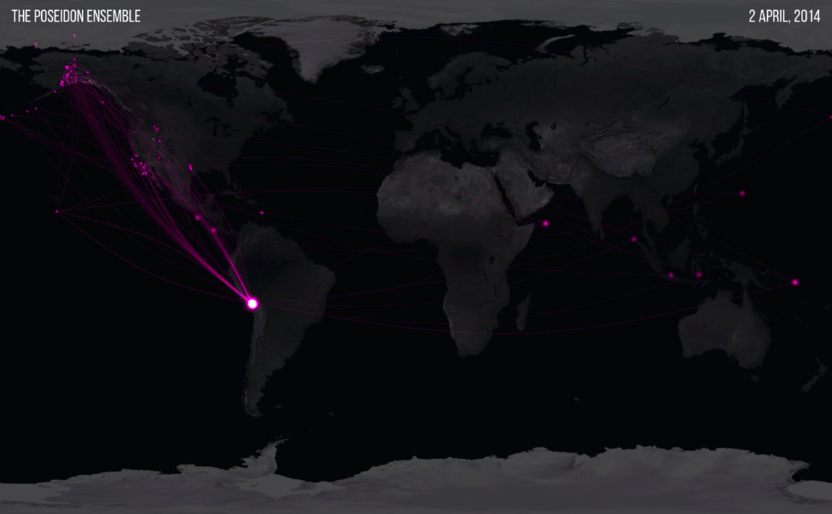
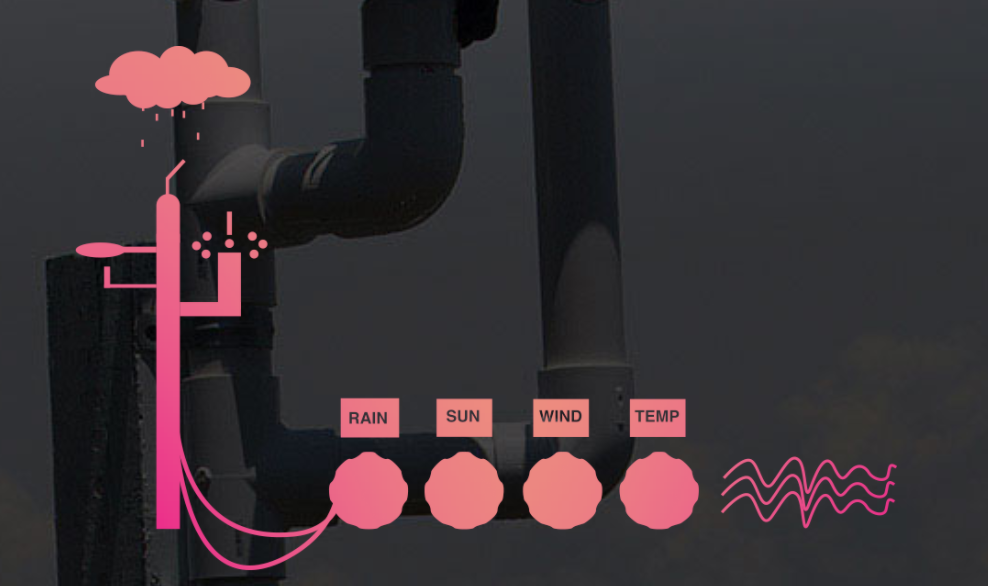
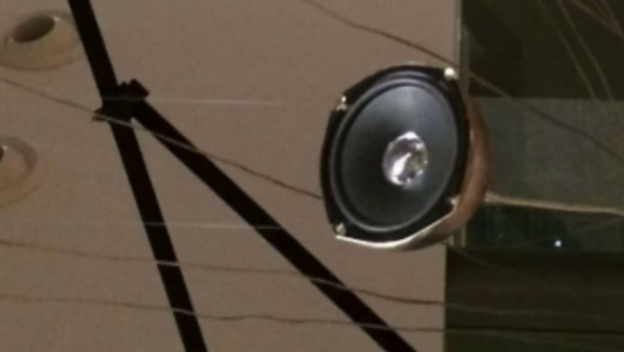
Broadcast is particularly focused on what we call ‘Imaginary Leaps’— the conceptualization of places and spaces that data venture to on their journey to and from the home. We argue that more abundant, playful, and imaginary encounters with home data might offer a site for reclaiming data for home dwellers. Broadcast uses sound as an analogy to interpret and imagine data’s travel. Specifically, the sounds focus on two aspects of data: how they travel, and where they go. Broadcast provokes people to imagine data’s volume, speed, intensity, and destinations.
Broadcast is one of the three artifacts in the Odd Intepreters family. View project details for Soft Fading and Data Bakery.
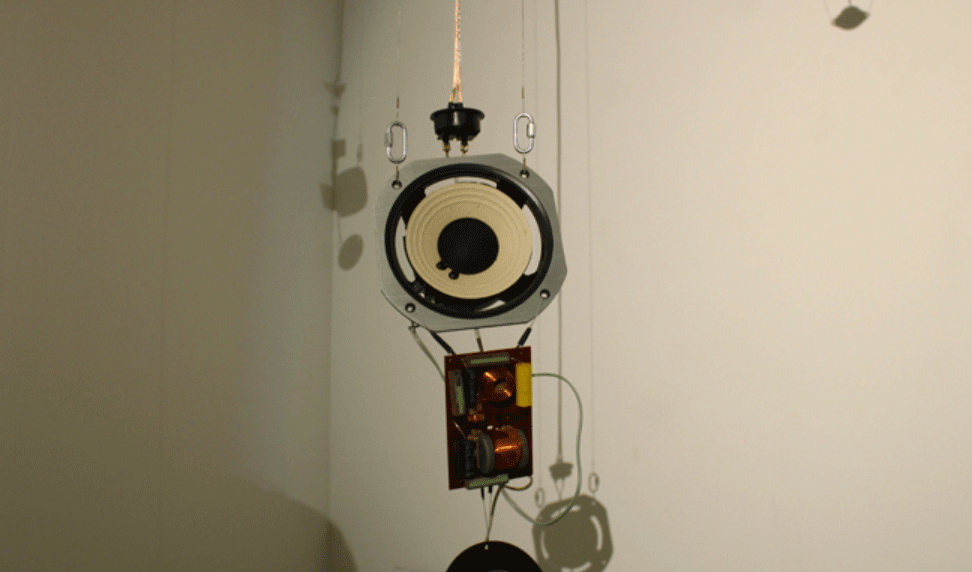
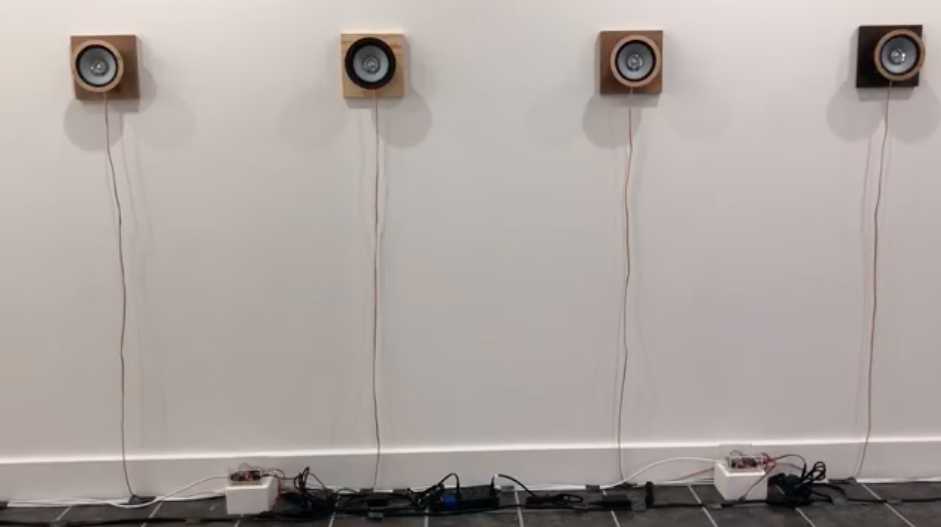
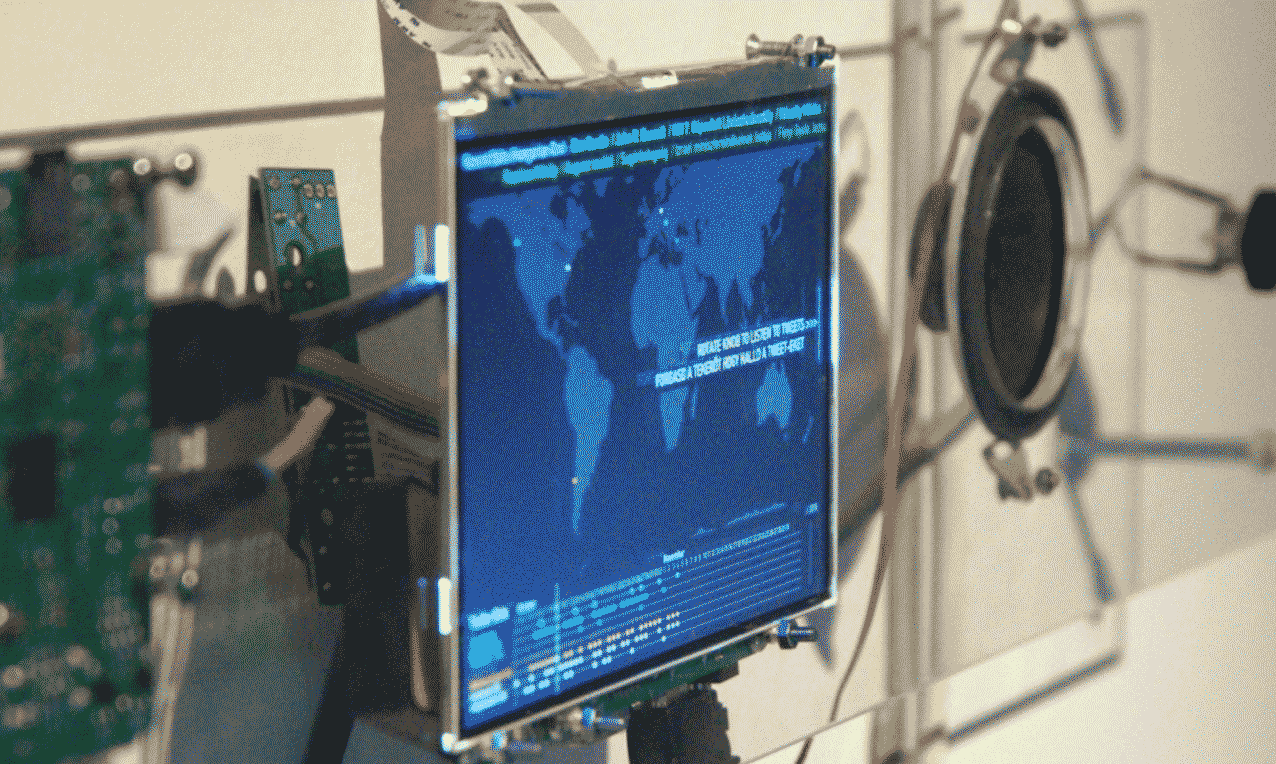
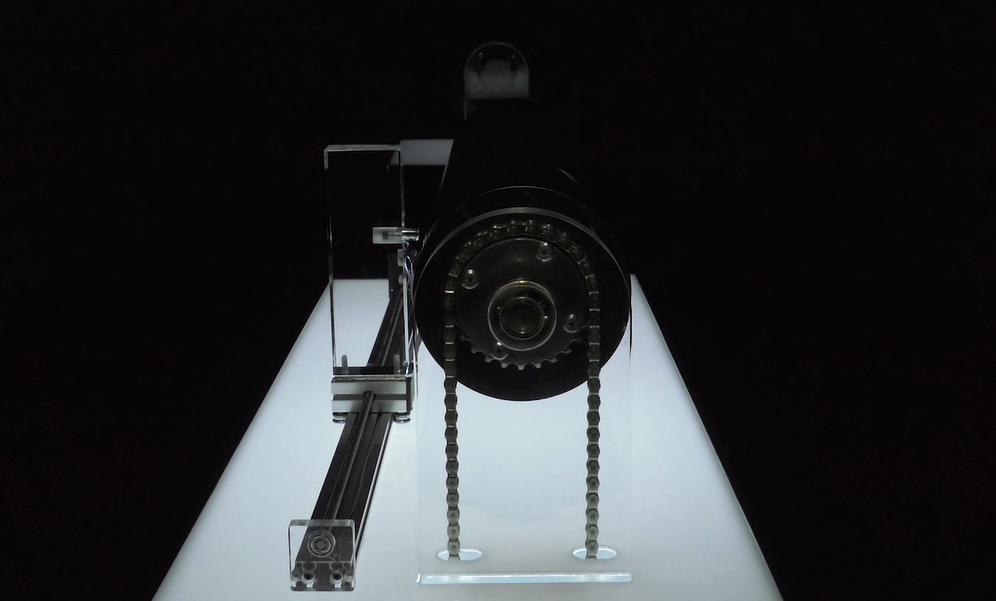
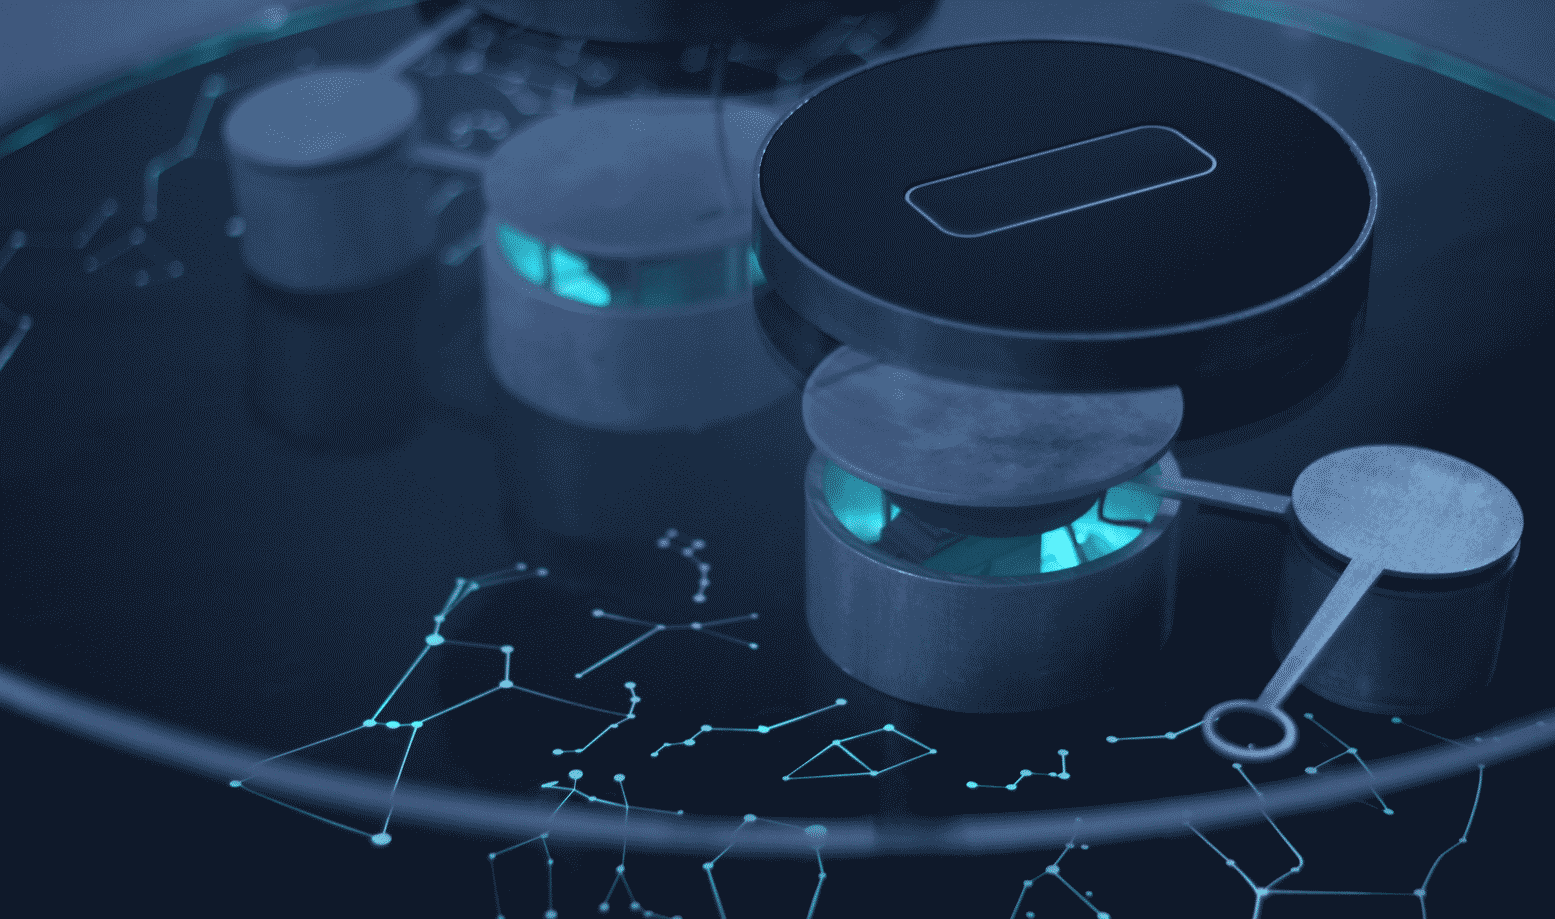
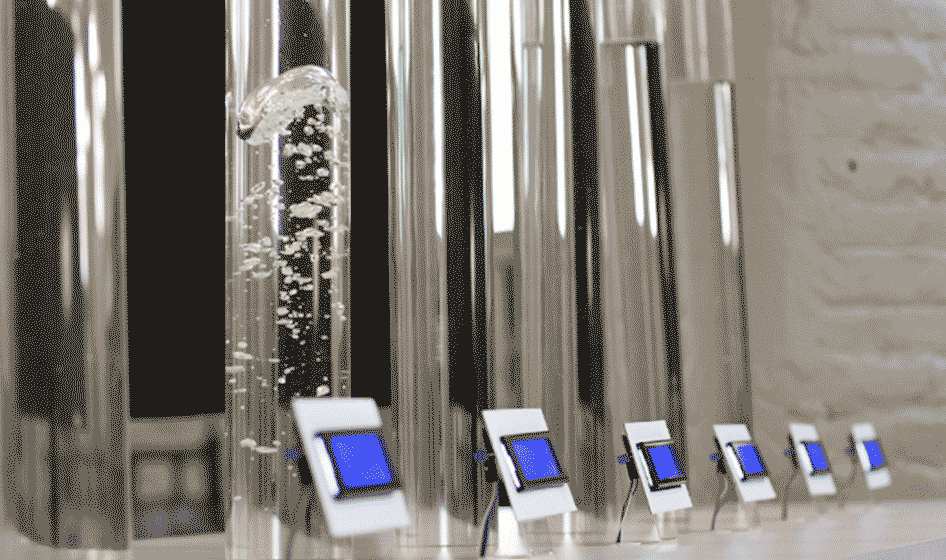
Broadcast tunes into Alexa’s data traffic activity in and out of the home, and interprets the data’s travel into imaginative sounds.
Broadcast is comprised of a raspberry pi microcontroller, a small speaker, and a rotary encoder attached to the blue resin sphere. Early on in the process, we were drawn towards the idea of a dial so that people could ‘tune into’ data. When we originally proposed this concept, we had imagined that data were sent and received only when interacting with Alexa via voice. We were under the impression that Alexa is only active once her wake word is spoken. However, to our surprise, Broadcast showed that the Amazon Echo device is constantly sending and receiving data: it is checking if it is still online, if there are new updates, etc.We worked with a sound designer, Trevor White, to create 14 soundclips that could represent the modes in which data travel in and out of the home. These sounds are inspired by physical places data travel (e.g. data centers) and how data travel (e.g. while in tubes or underwater).
These two categories of data’s journies, Data in Transit and Data at a Location, comprise Broadcast’s sound design. The ephemerality of Broadcast’s sound design and interaction is important to demonstrate how data are always moving, they are not in the home, but rather part of large meshes of mobile data.Publications
Audrey Desjardins, Jena McWhirter, Justin Petelka, Chandler Simon, Yuna Shin, Ruby K. Peven, and Philbert Widjaja. (2023). On the Making of Alternative Data Encounters: The Odd Interpreters. CHI'23 New York, ACM Press.
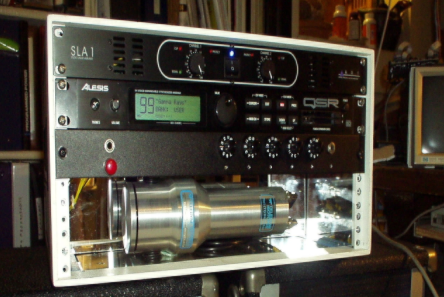
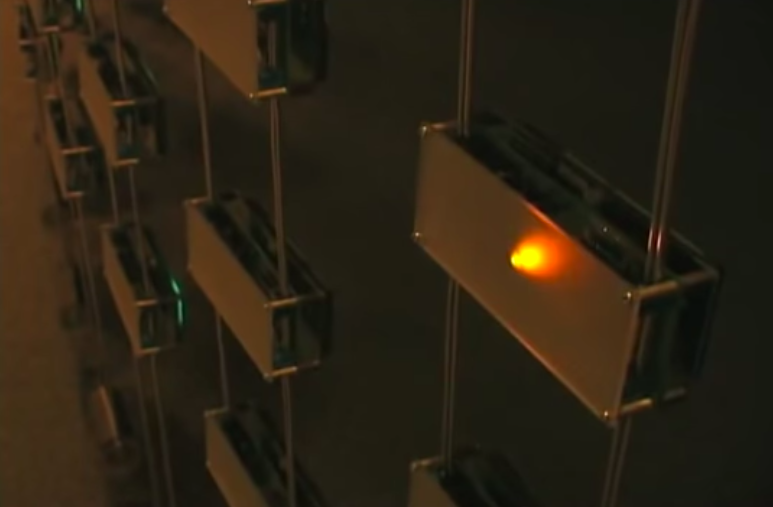
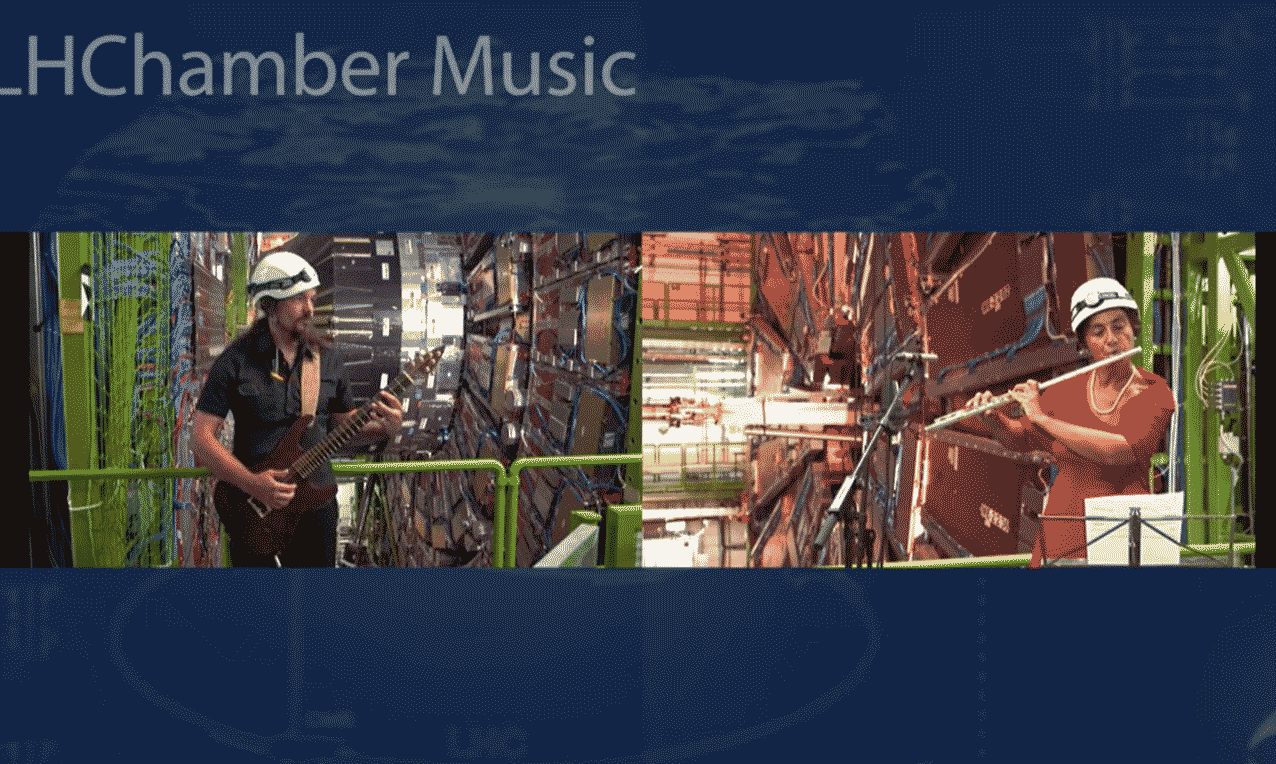
Viola Gatti Roaf, Cecilia Blencowe, and Miles Blencowe
| 2021
A soundscape created by Viola Gatti Roaf, Cecilia Blencowe, and Miles Blencowe. Data from several experiments converted into sound by either speeding up or slowing down the signals so as to be within the audio frequency range.
0:00 "Cooling Down"
0:43 "Nanobells"
2:47 "Phonon Ricochet"
3:02 "Liquid Phonons"
3:27 "Laser Photons"
3:55 "X-Ray Ballooning"
4:33 "Magnetic Storm"
Data provided by the groups of Simon Gröblacher (Delft), Eddy Collin (Grenoble), Andrew Cleland (Chicago), Jack Harris (Yale), and Robyn Millan (Dartmouth). Supported by The Neukom Institute For Computational Science and The Women in Science Project at Dartmouth.
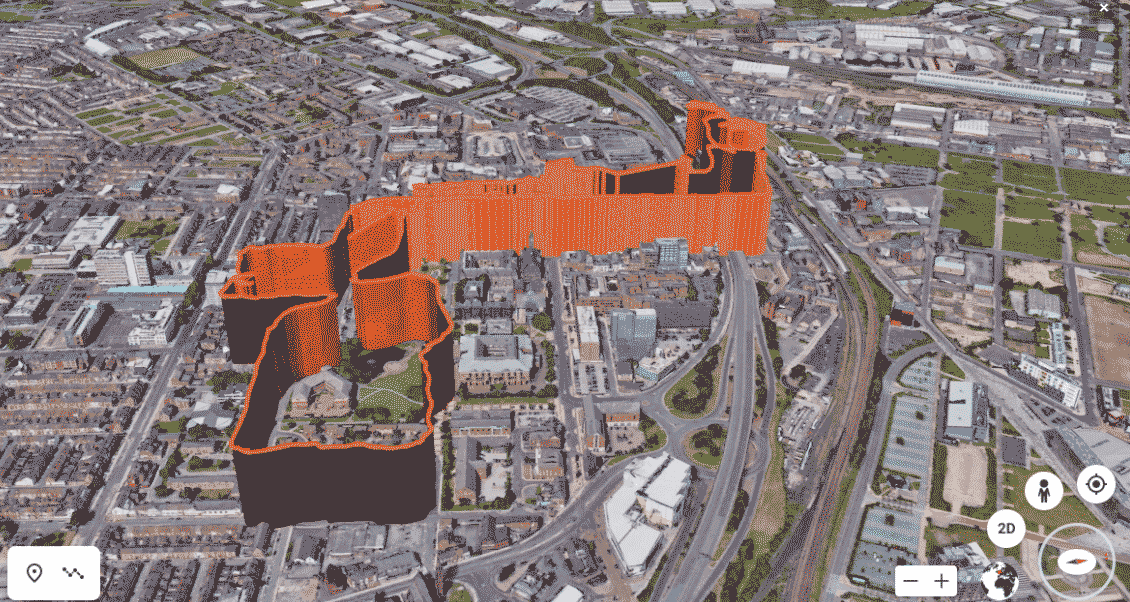
G4ViD - Geology for the Visually Impaired and the Disabled
University of Patras
| 2020
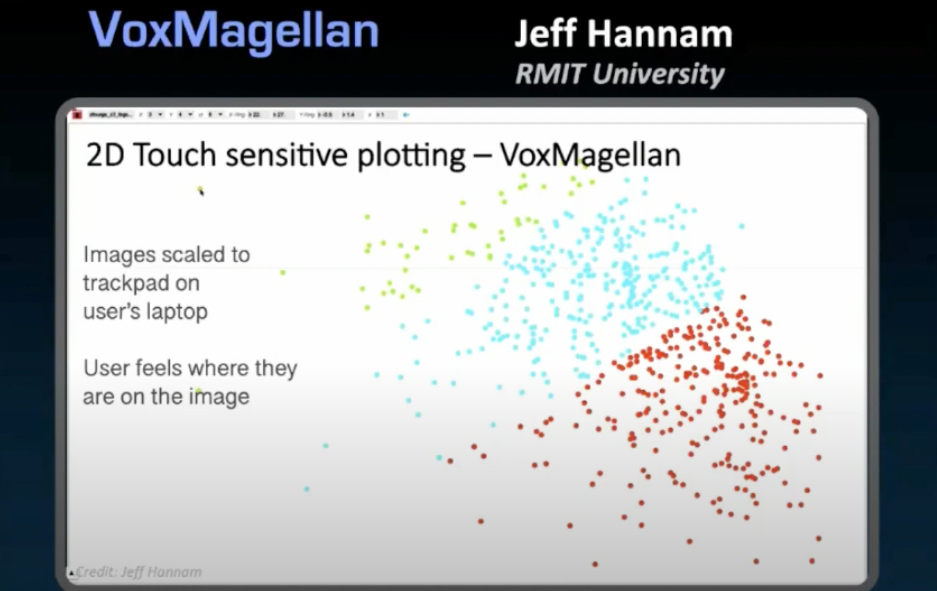
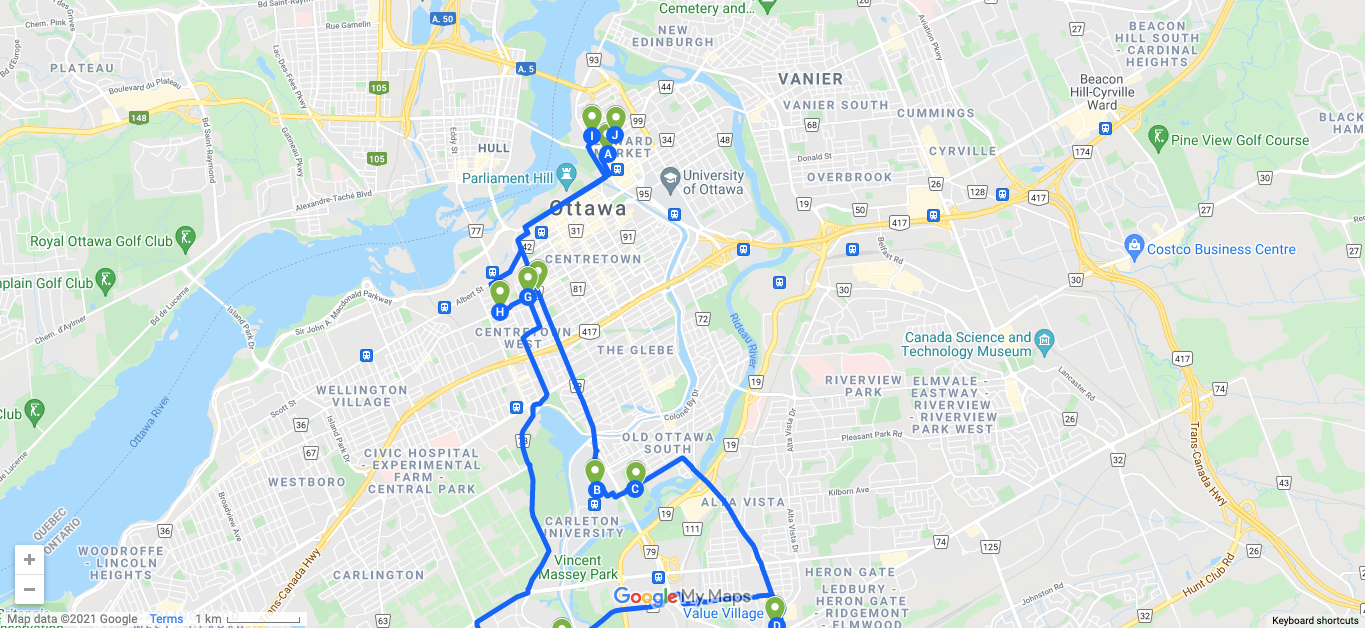
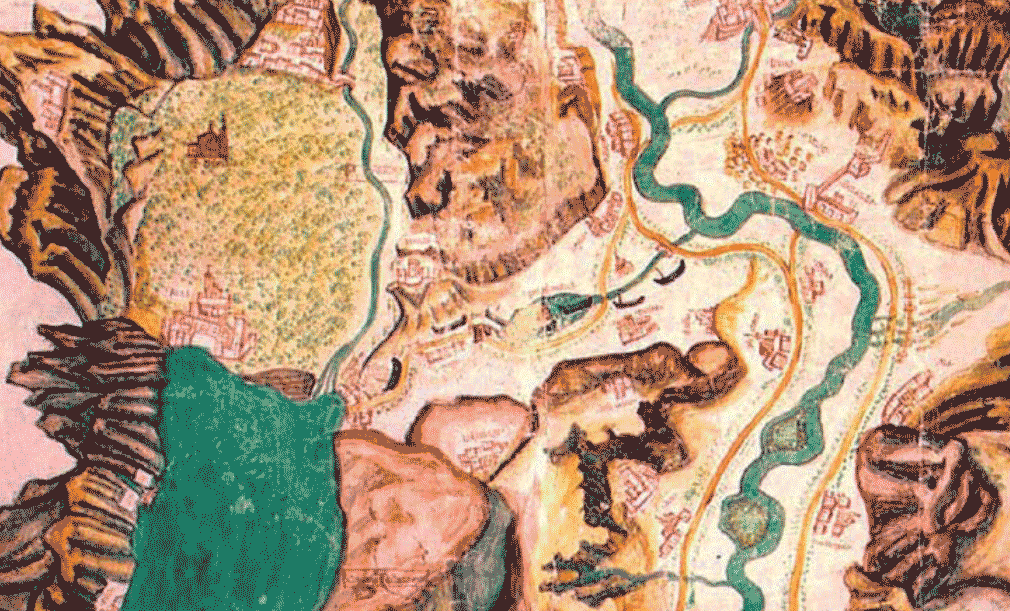
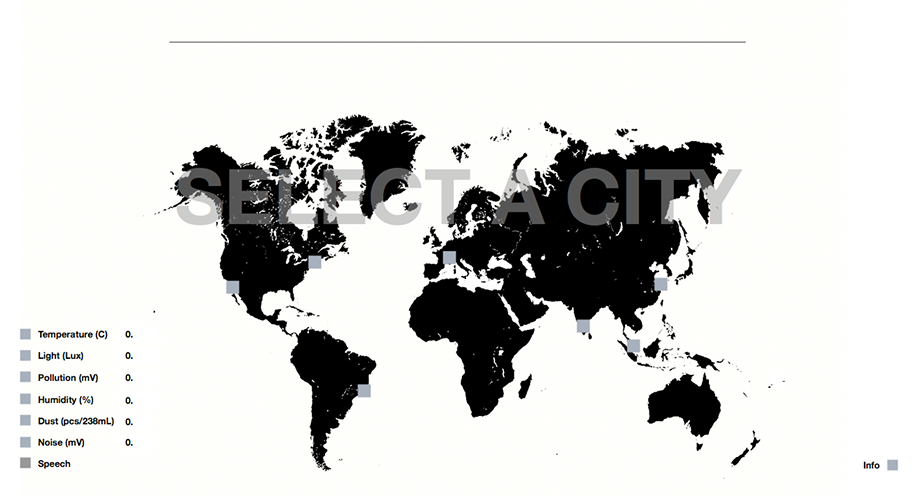
G4ViD is a project that aims to provide students and educators, with special emphasis on the disabled and the visually impaired, the opportunity to enjoy the experience of Geoparks and introduce them to the Earth Sciences. The project also aims to provide the educational tools (maps and interactive audio-visual content) that will be developed for a remote understanding of the Geoparks for schools, teachers, and students as well as easier navigation for people with disabilities in real visits. Our main task in this project is to develop two applications and one interactive website related to Geology and Geoparks for the visually impaired and the disabled, as well as the general public. The first application will transform images and geological evidence such as fossils, rocks or petrified trees into sound. When this happens a visually impaired person can touch a touchscreen and “feel” according to the sound changes the shape of the fossil or geological evidence. The second application refers to a mapping and navigation application with special features for the disabled and the visually impaired. With this mapping application, a visitor in a Geopark can be assisted in their path, especially one with a disability. This route can then be available to other visitors either they visit the Geopark, or through the interactive website.
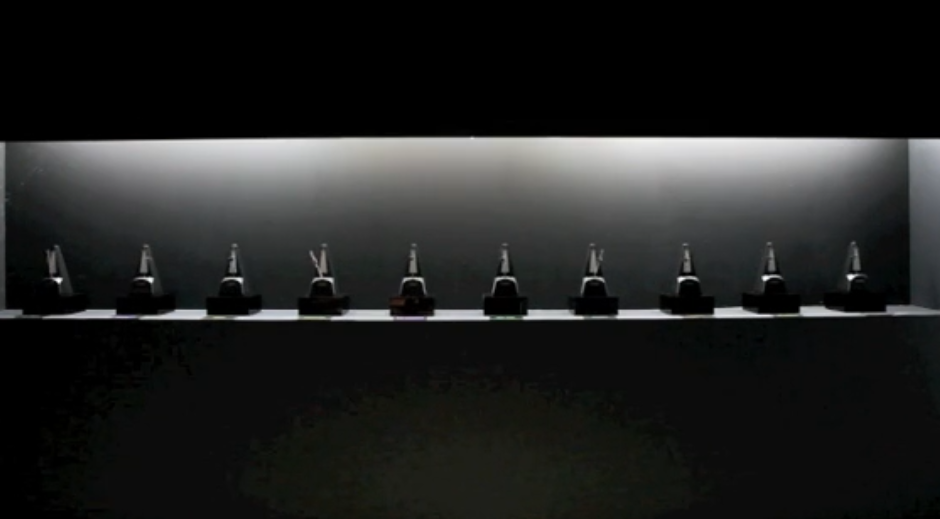
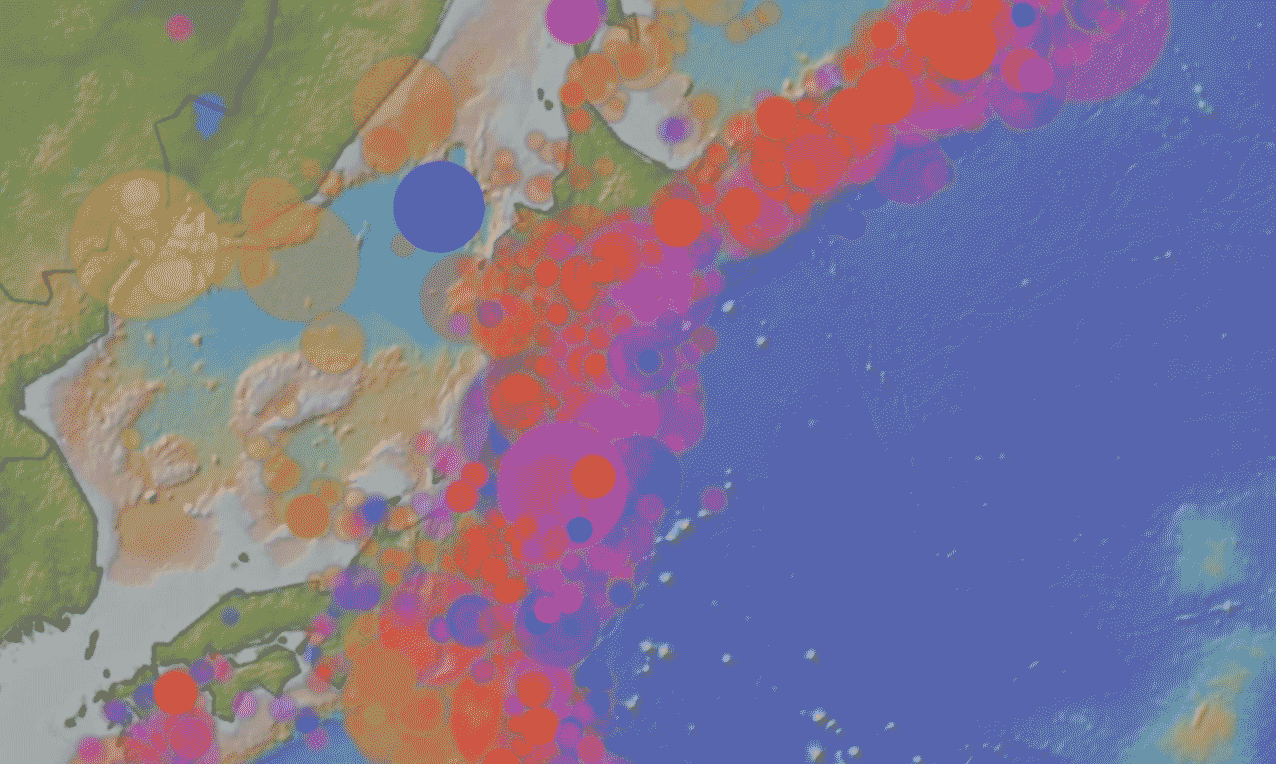
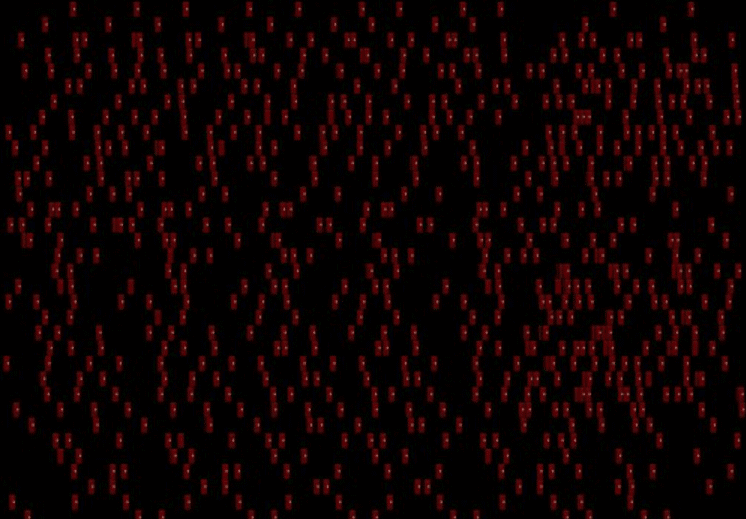
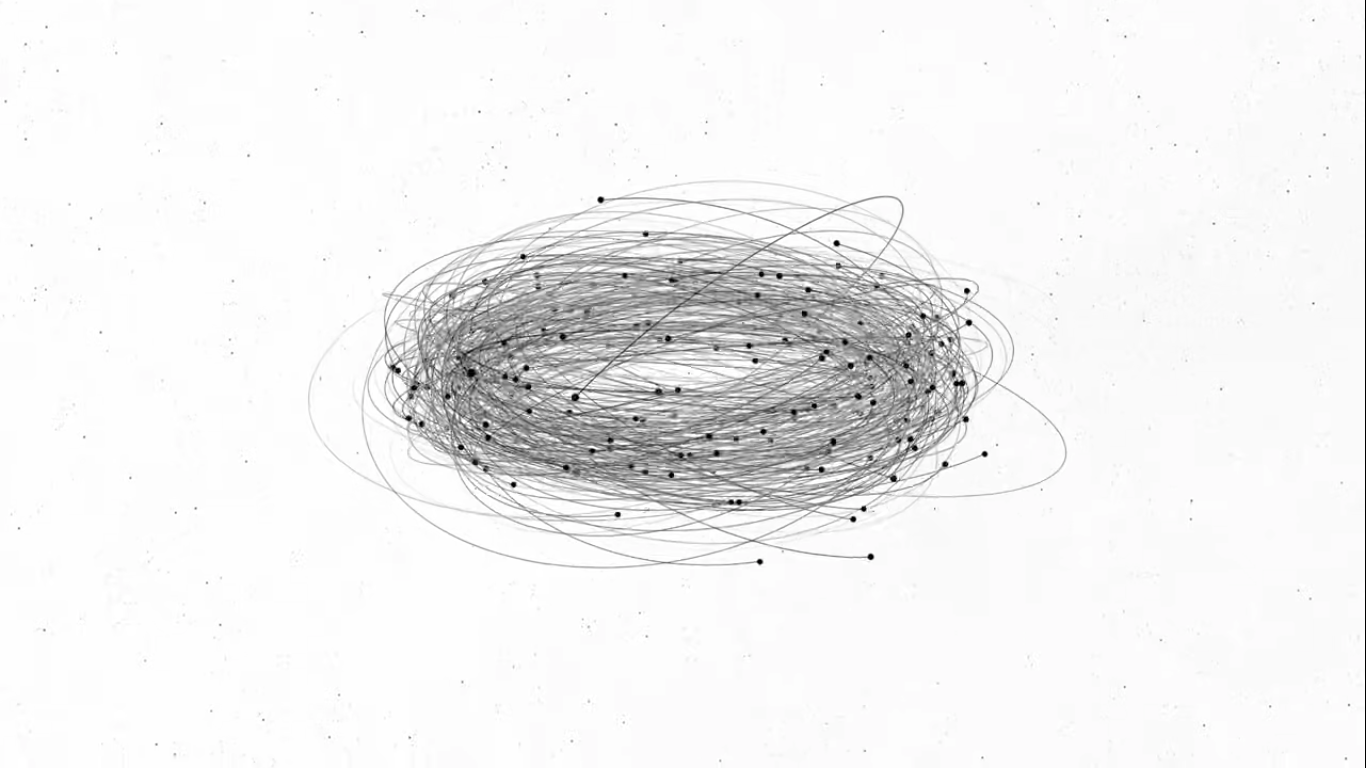
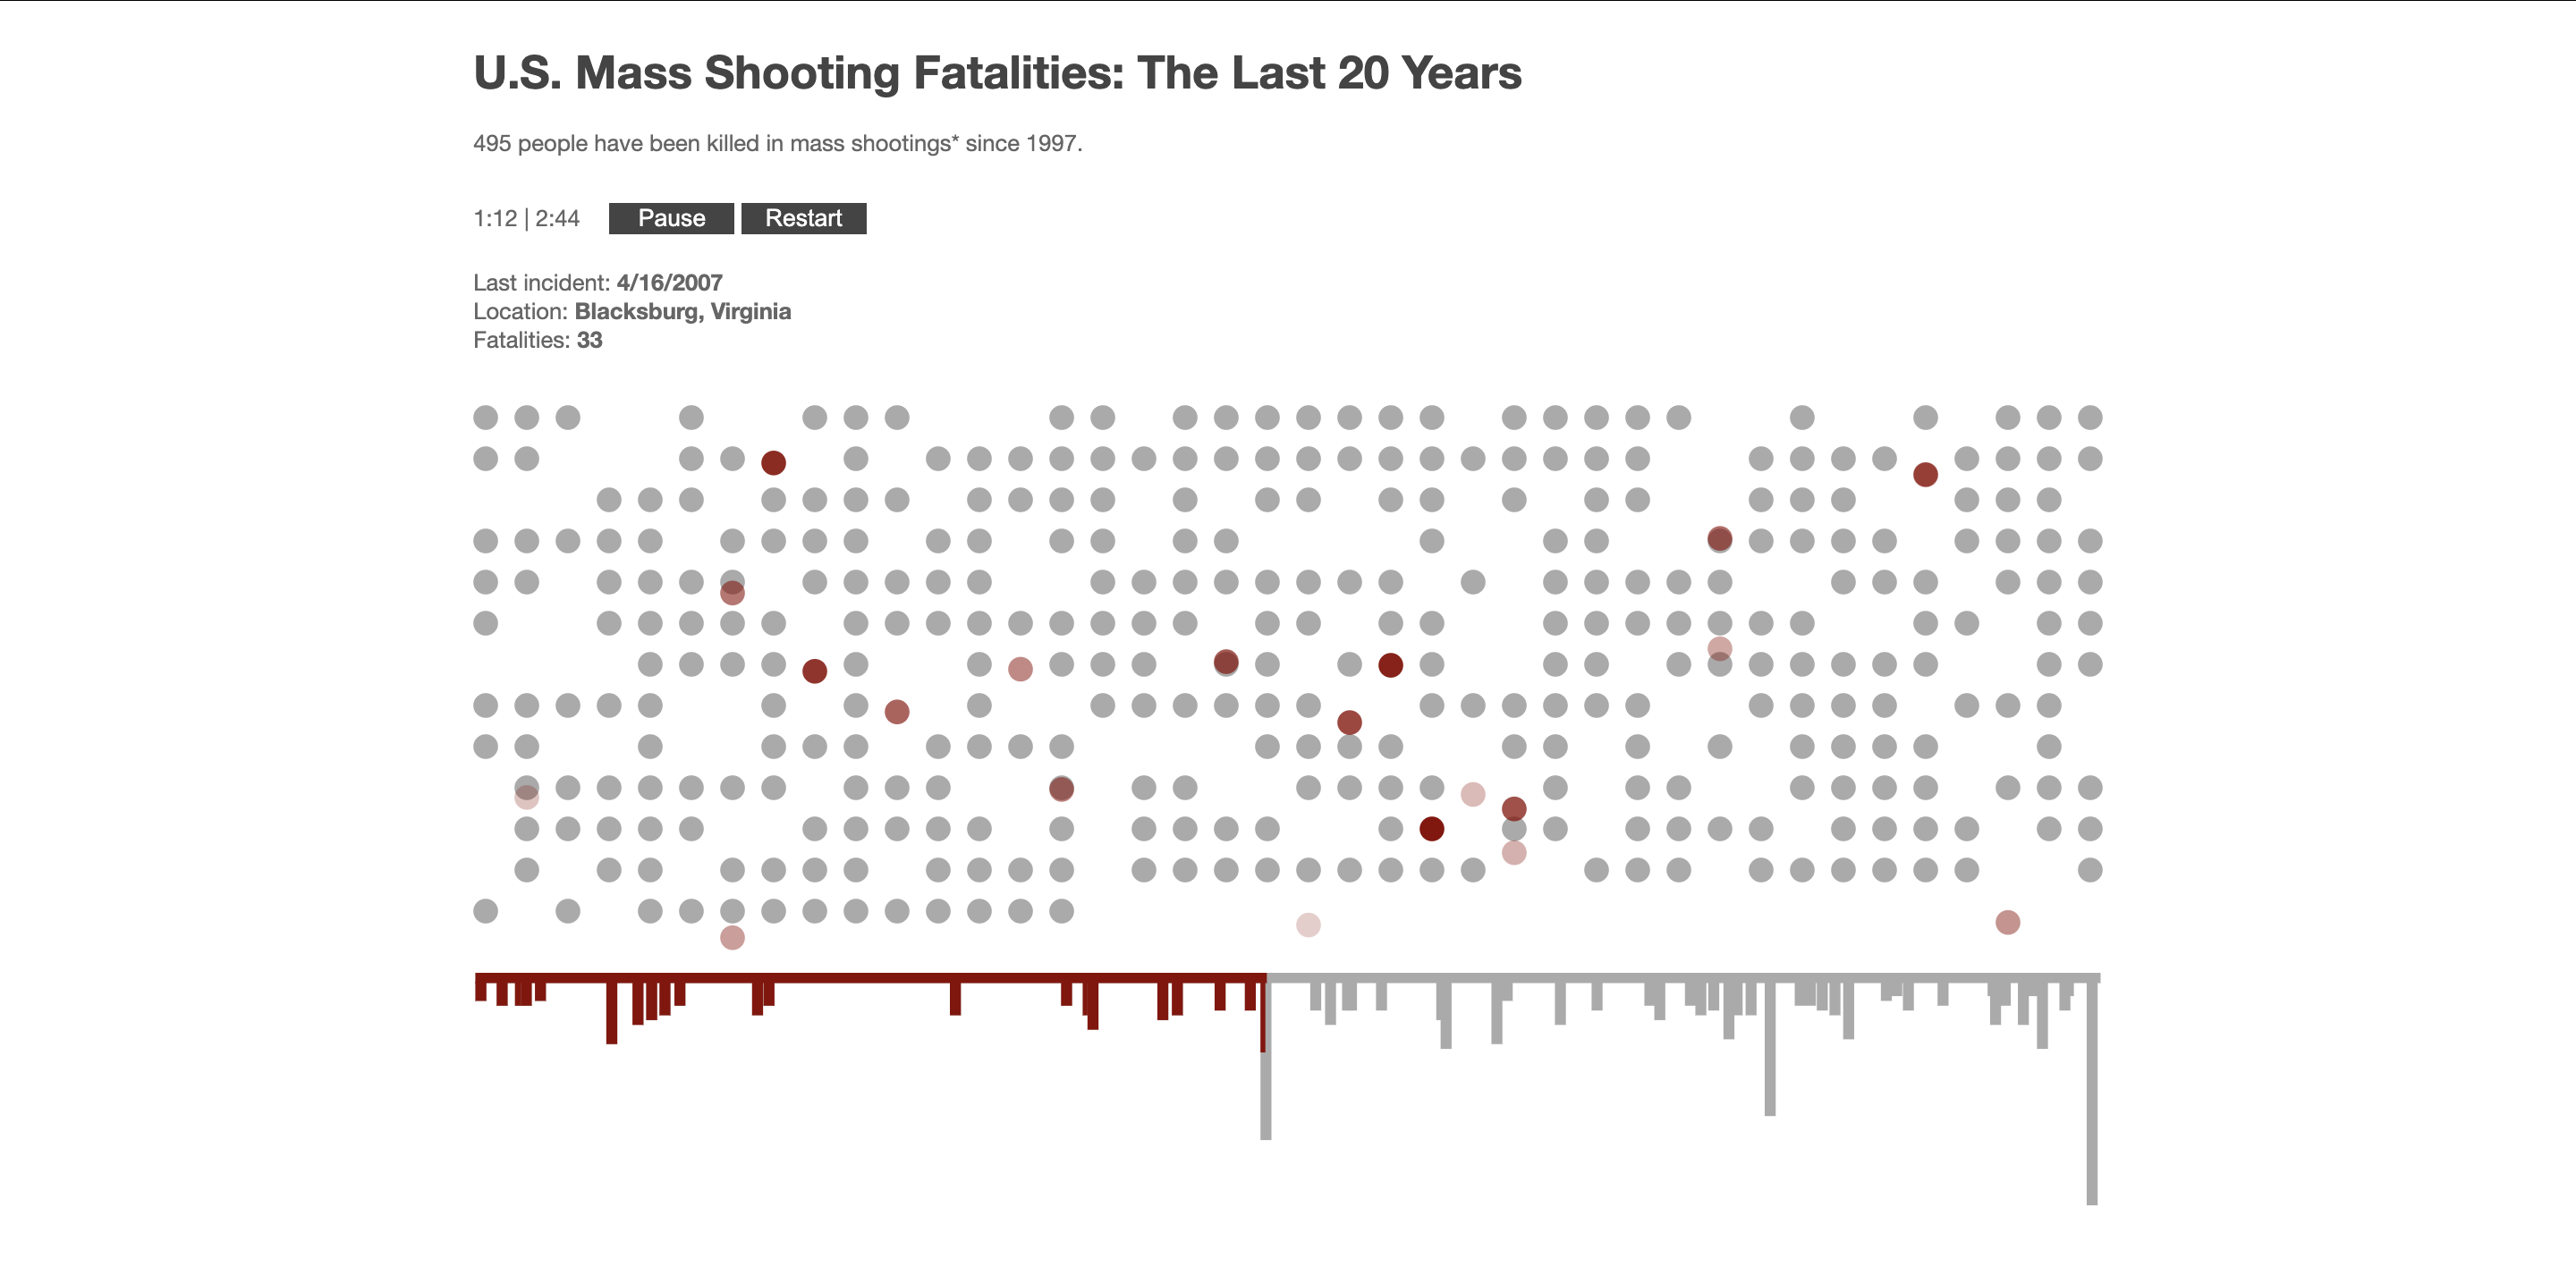
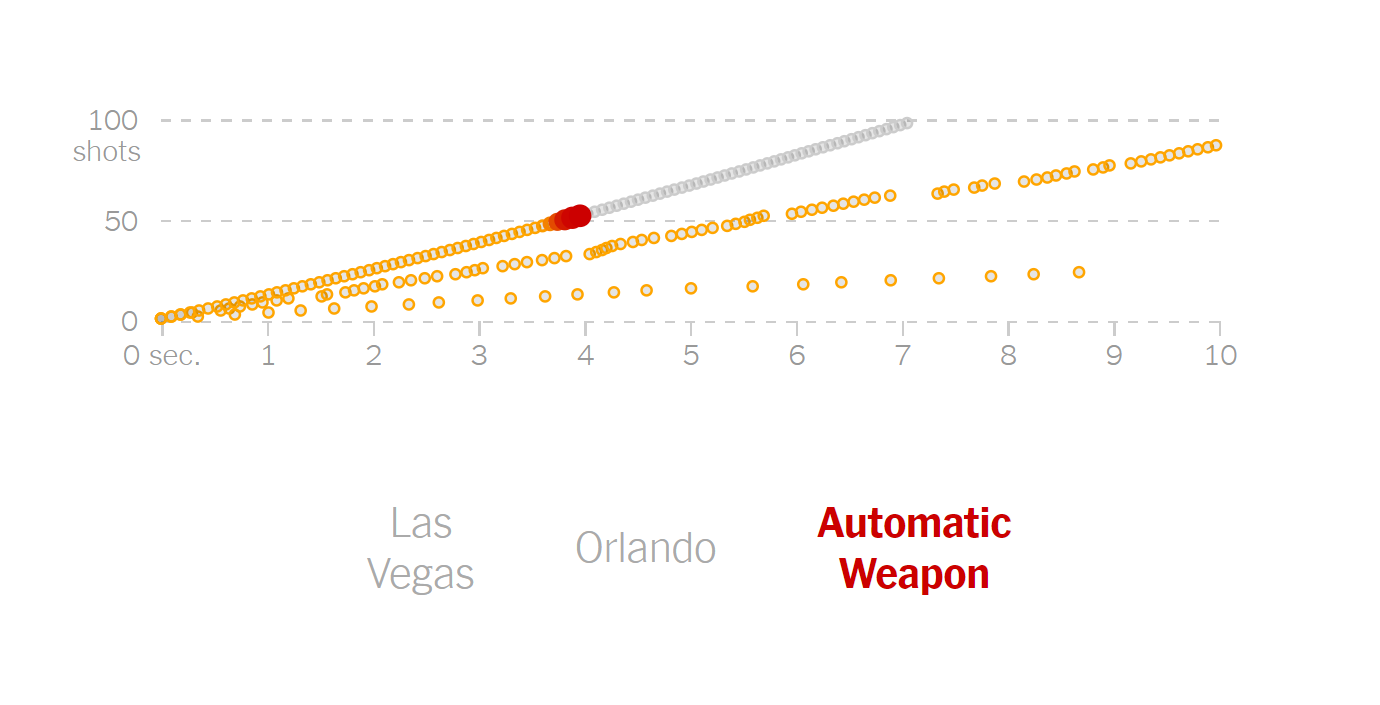
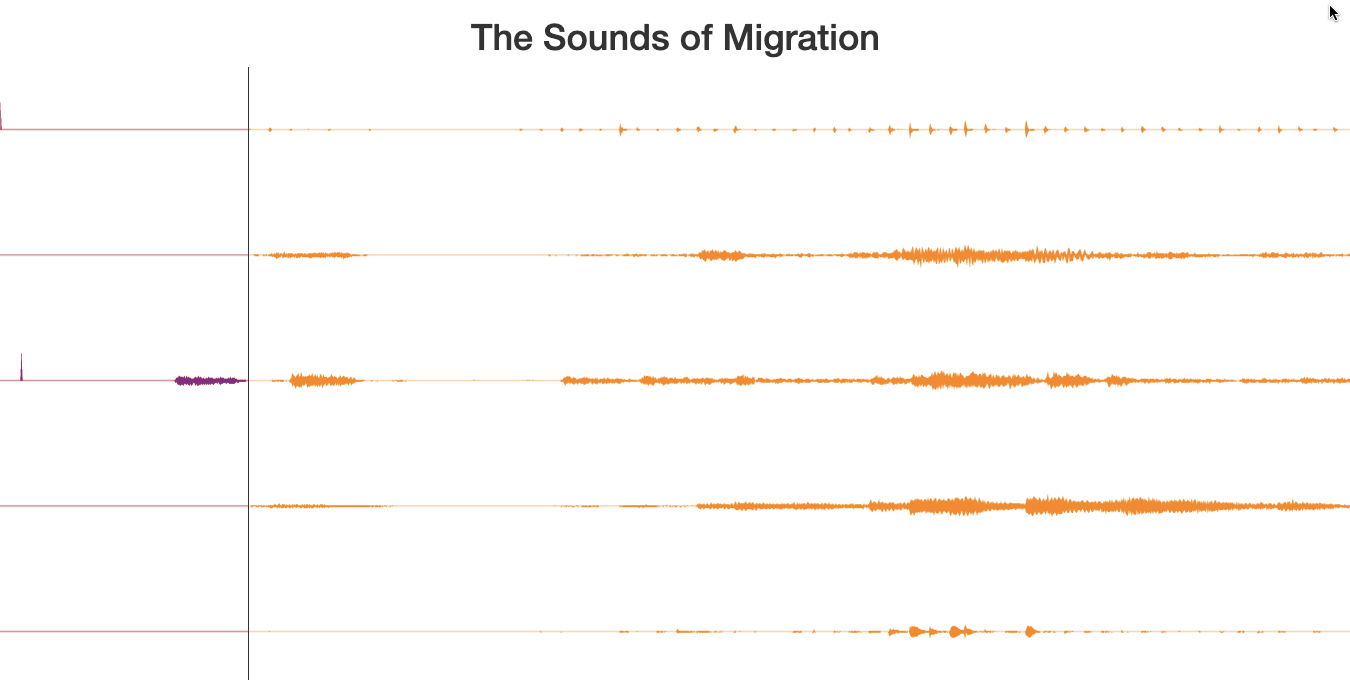
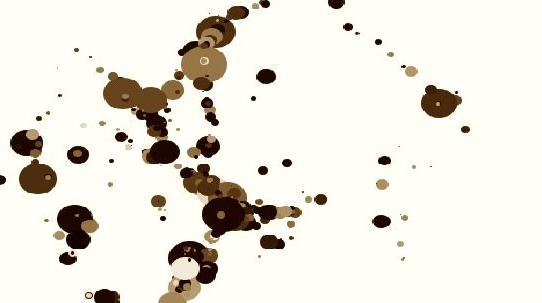
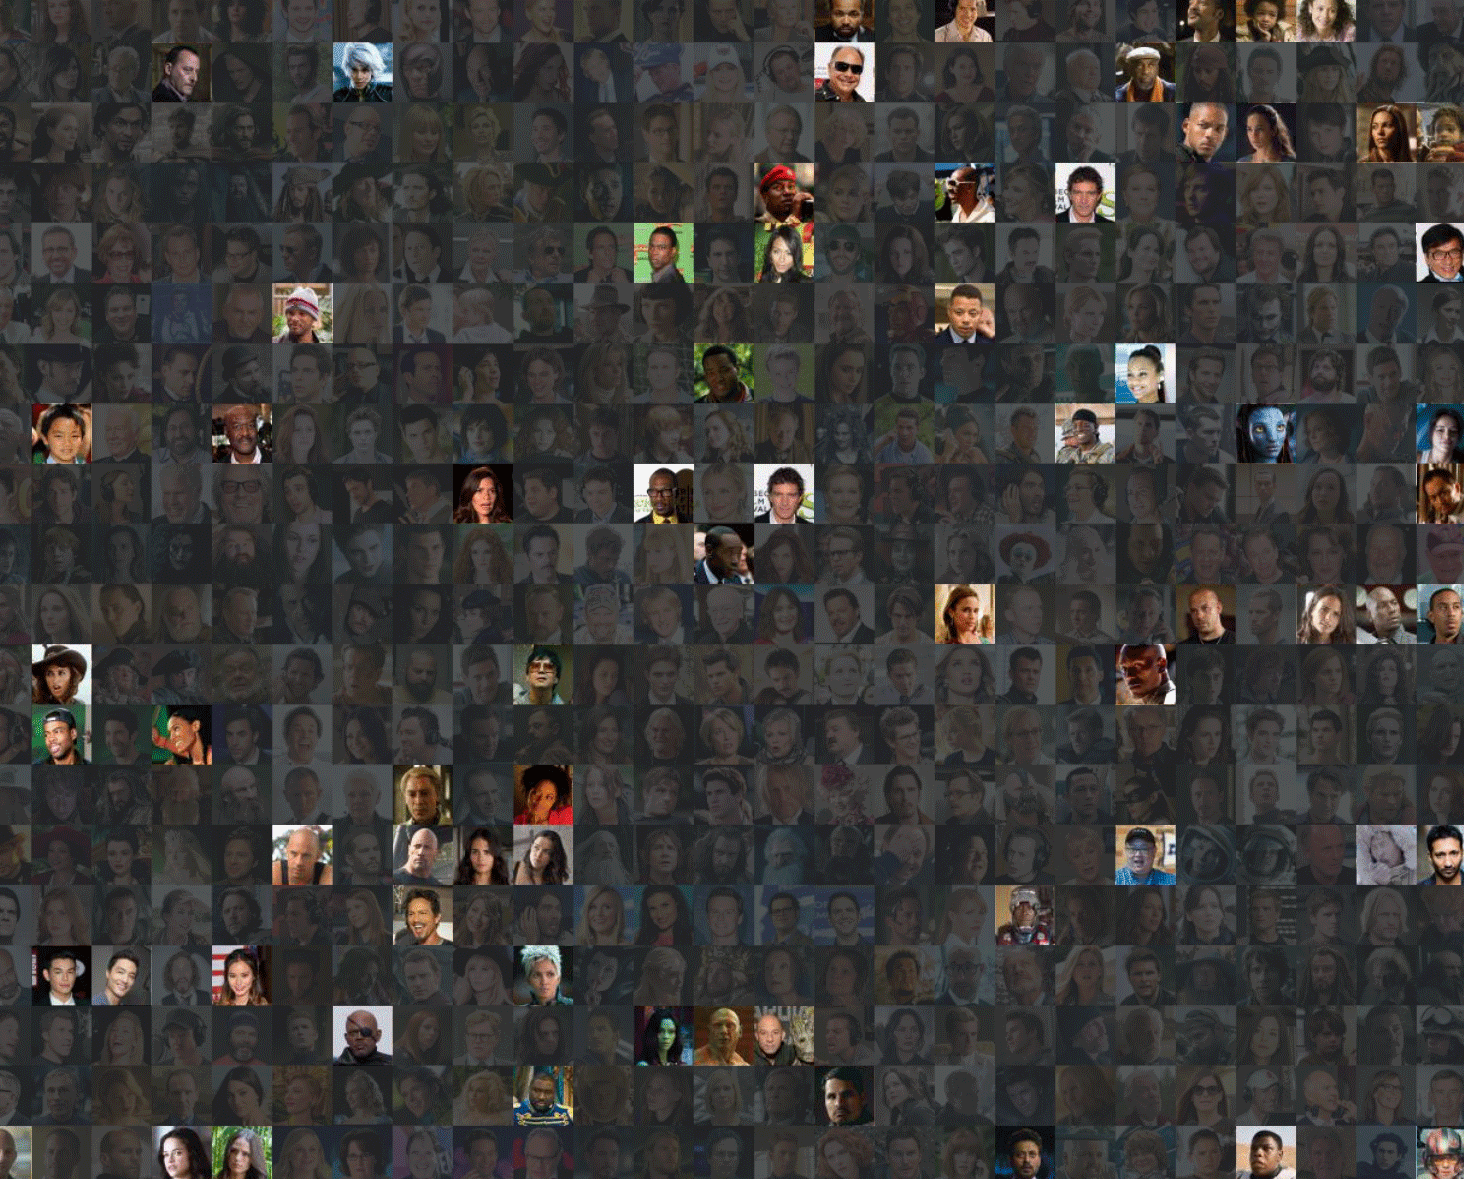
This animated data sonification illustrates the loss of life due to mass shootings in the United States since 1997. Each fatality is represented by a single orb in the illustration and a single note in the audio track. The time between clusters of notes is proportional to the time between each mass shooting incident.
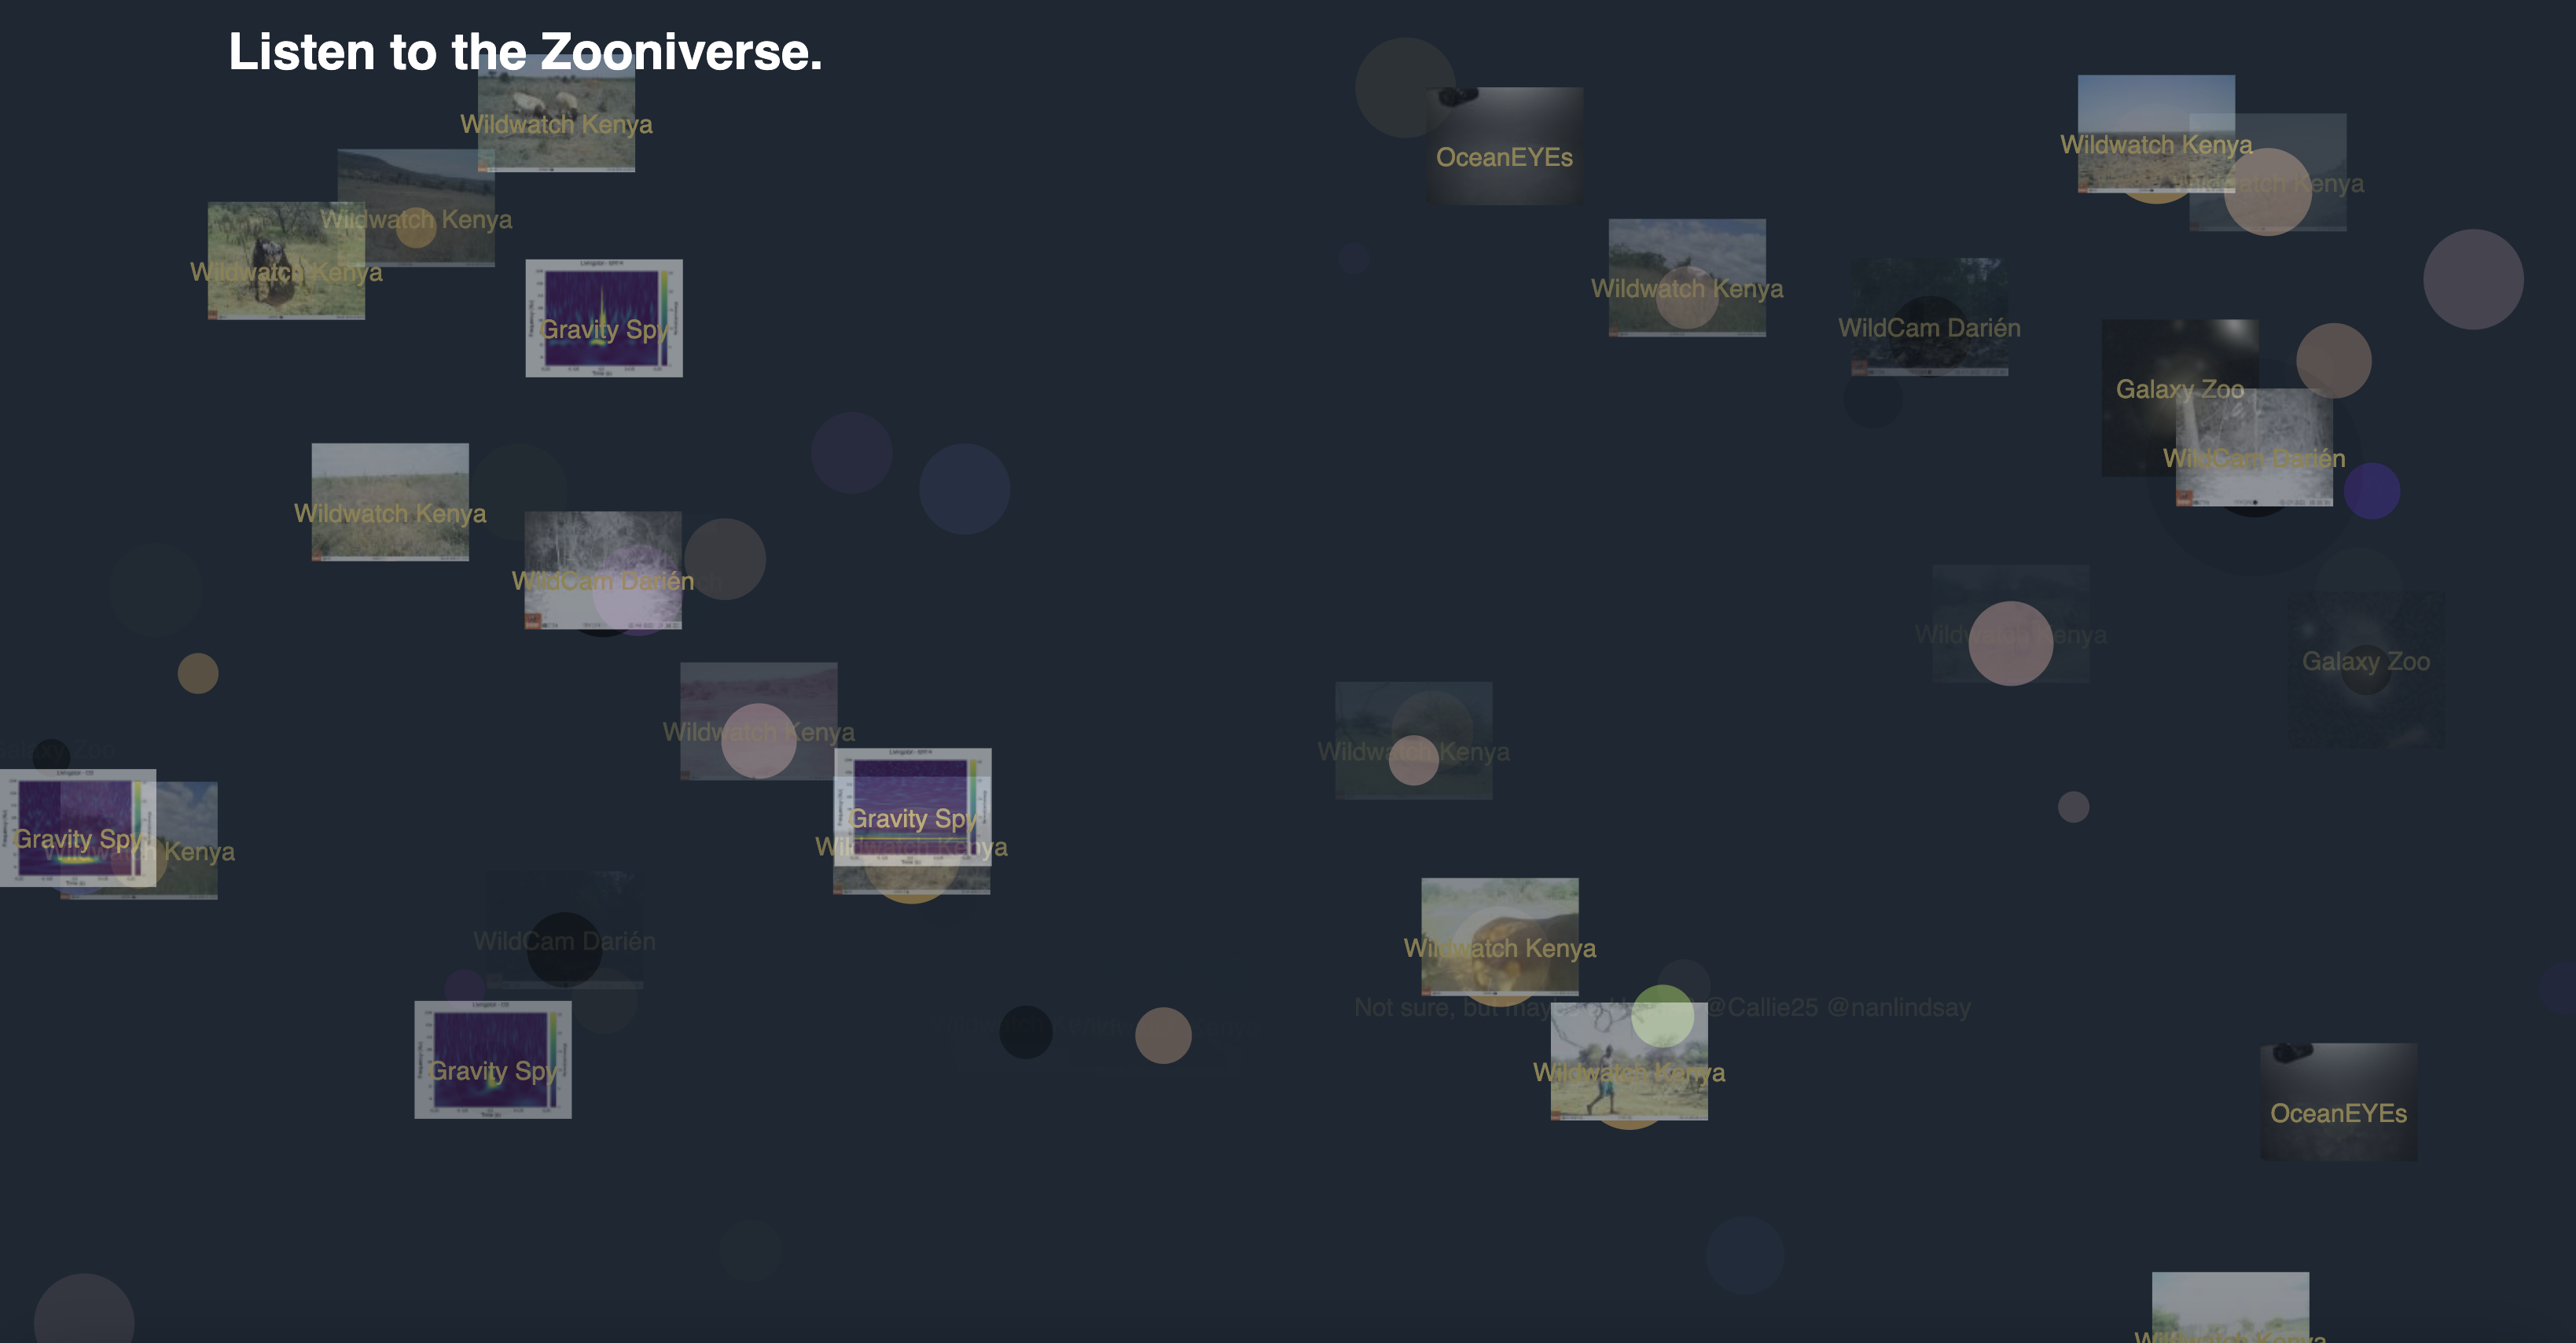
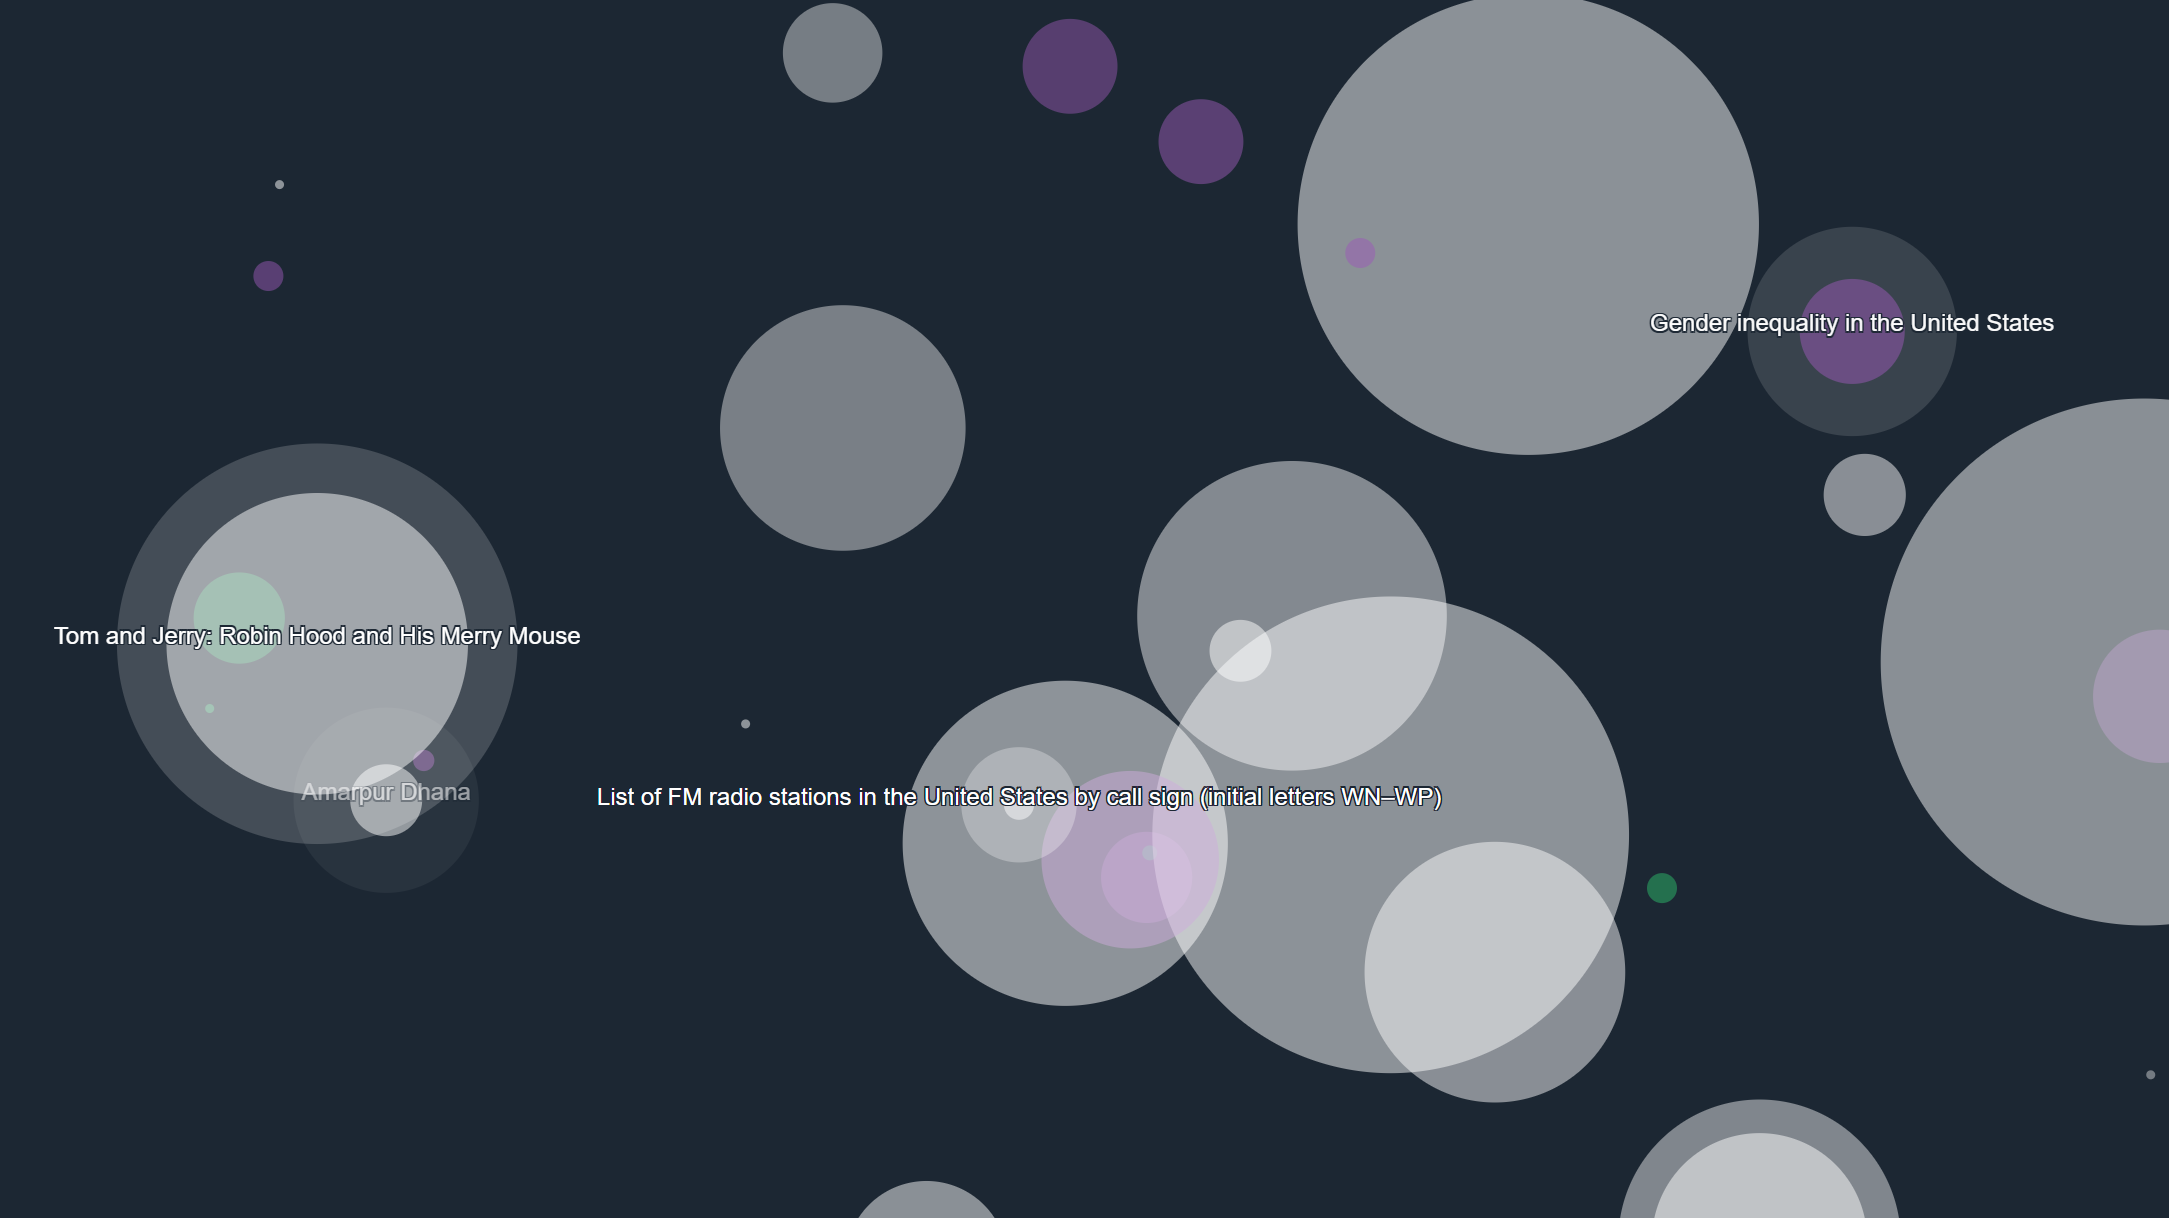
Listen to volunteer contributions to Zooniverse citizen science projects. Each new classification generates a short note. Discussion comments are broad, swelling tones.
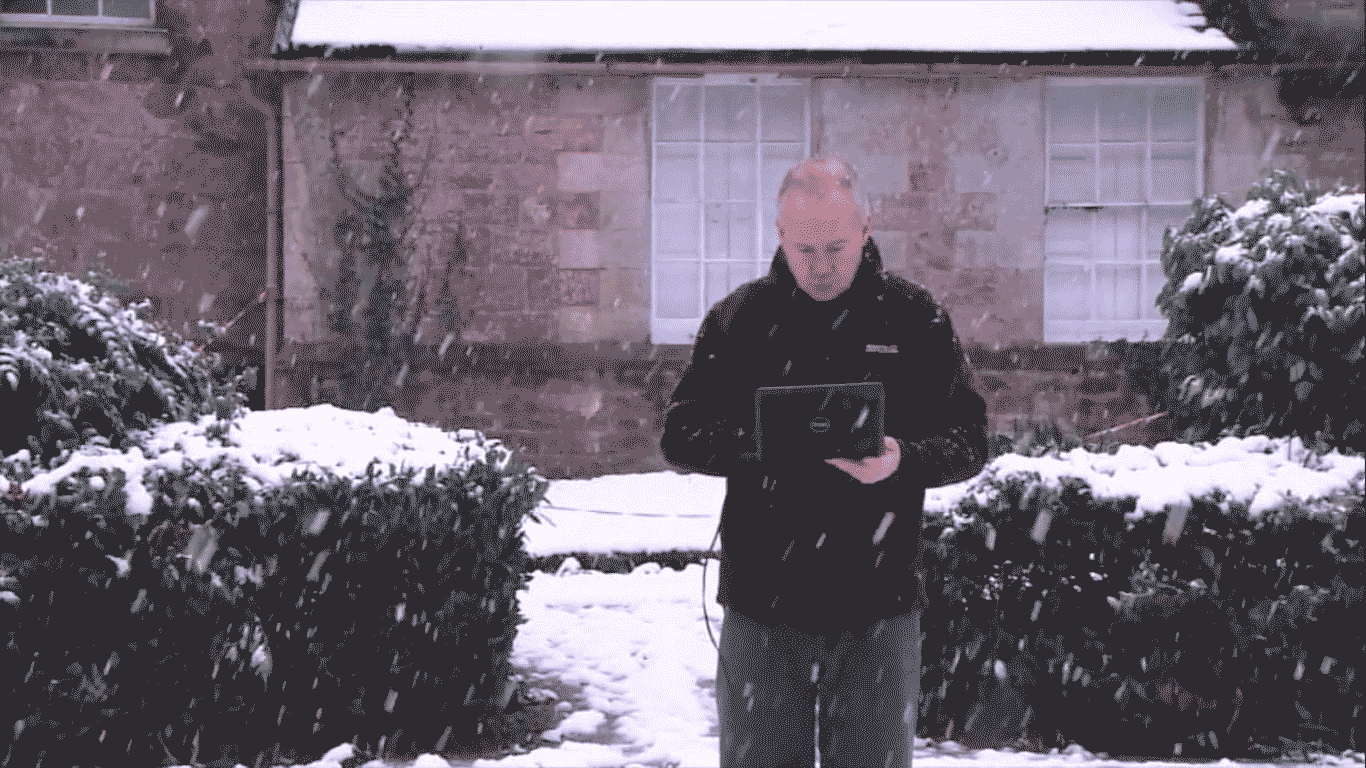
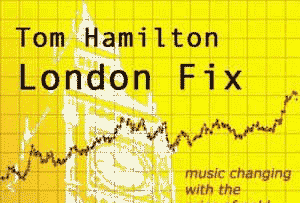
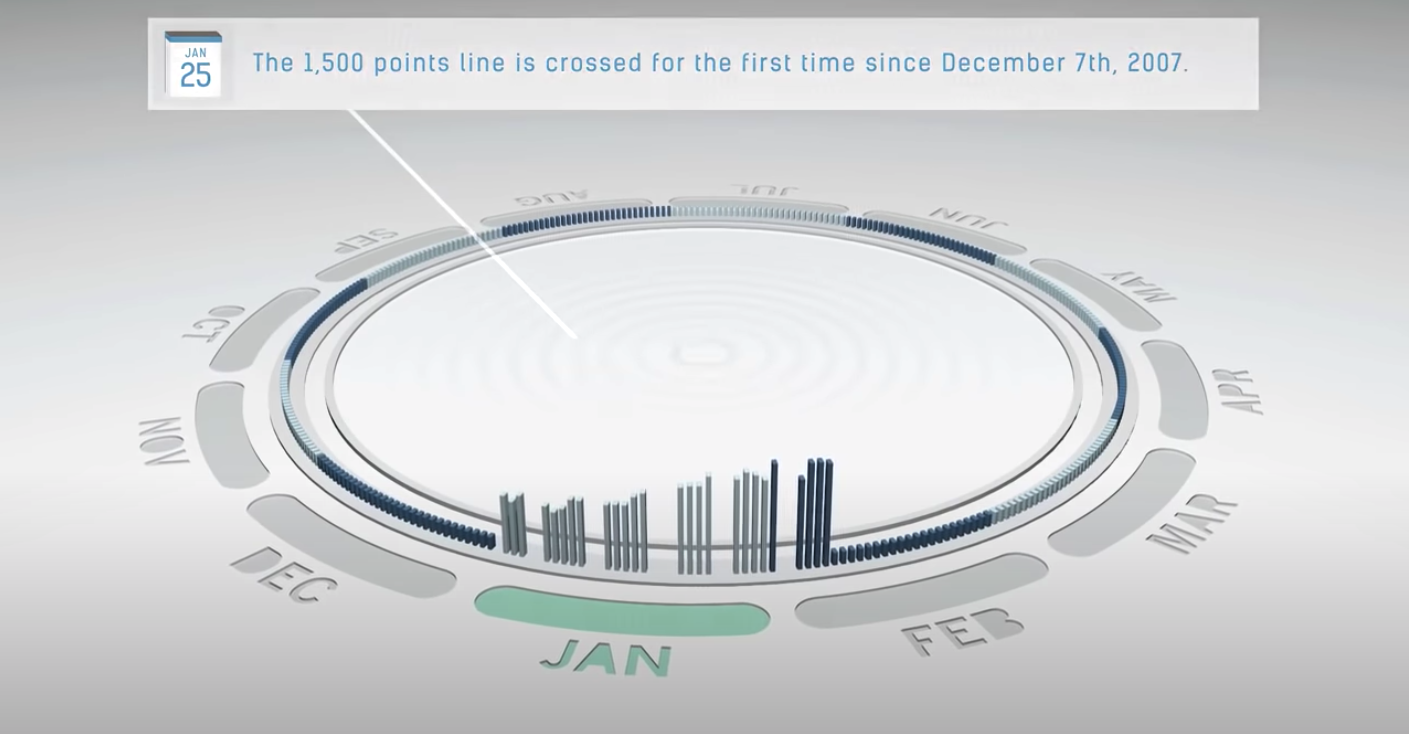
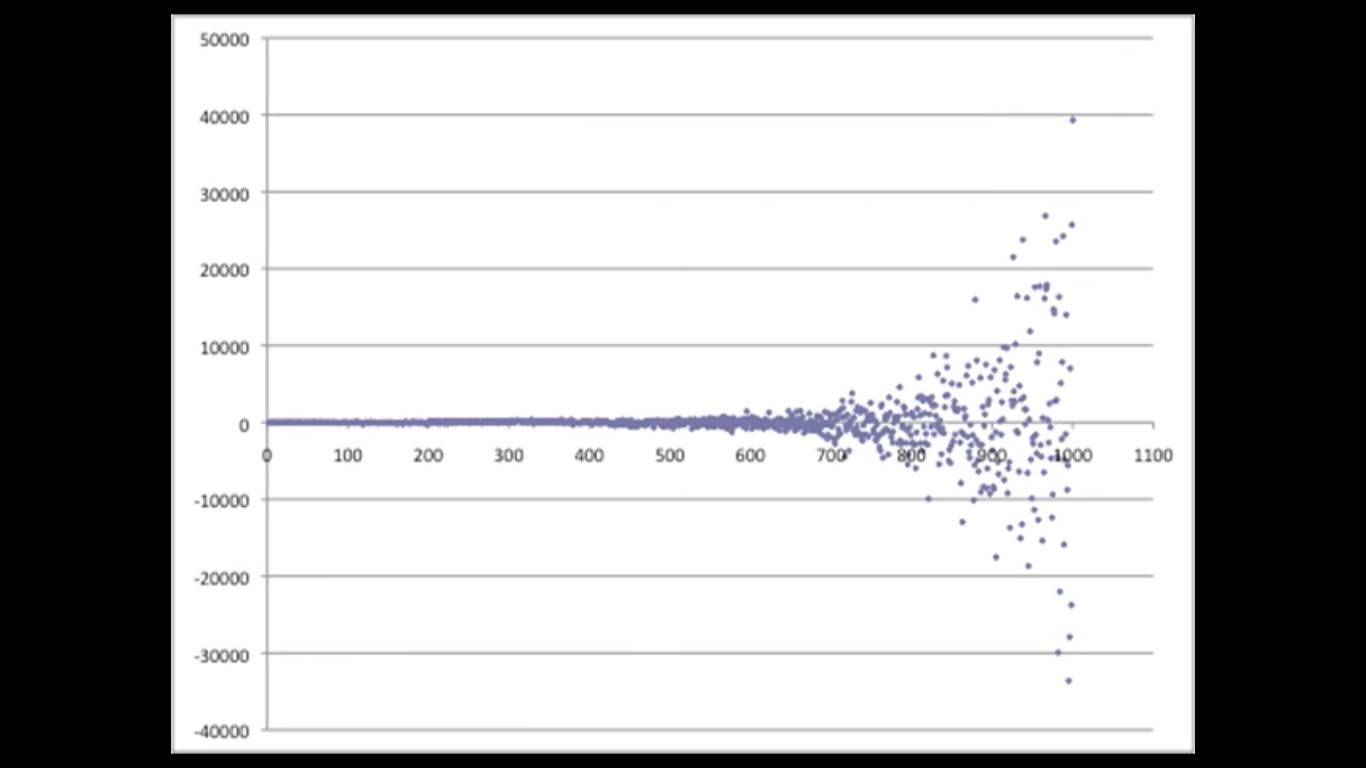
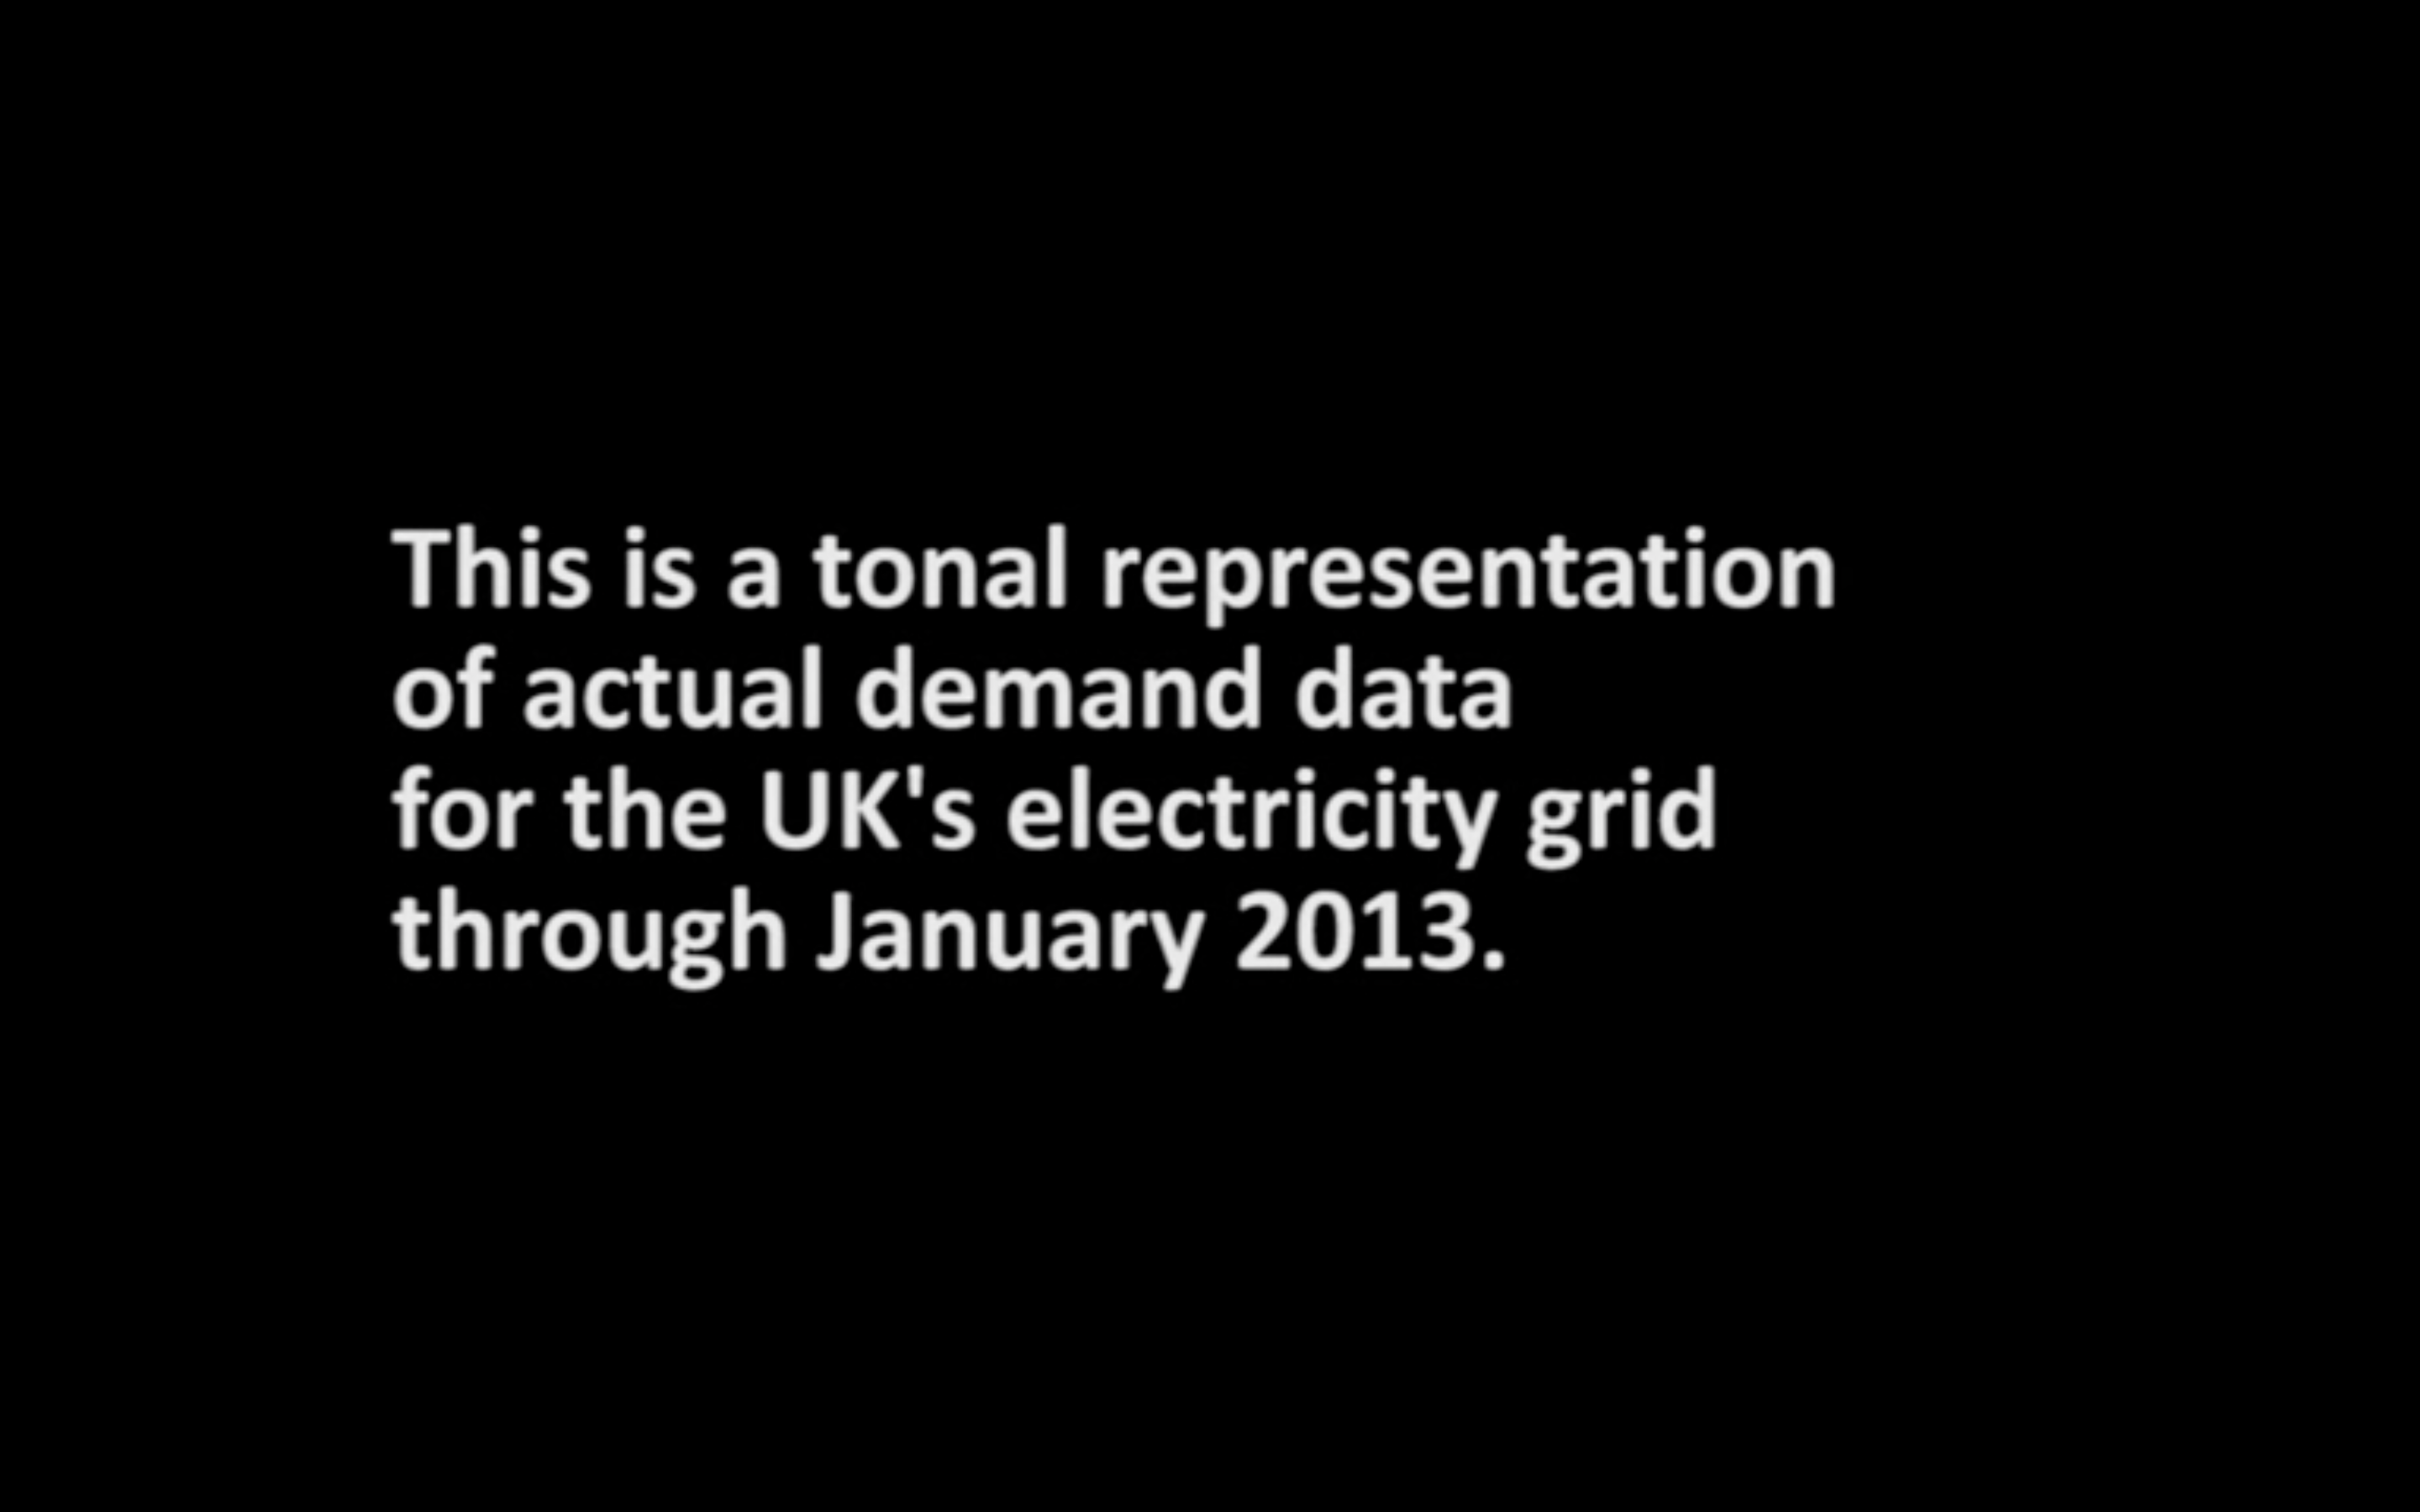
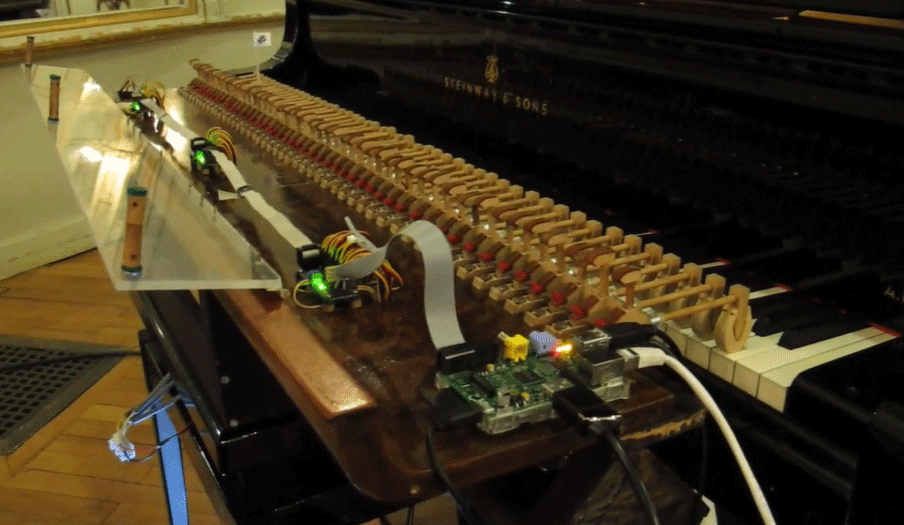
This video presents UK national electricity use data in the form of sound. Data are available at www.nationalgrid.com. Using VBA I converted half-hourly data for January 2013 into beeps with frequency determined by the size of the demand. I used Audacity to record the output, then played around with pitch and speed and added some reverb.
Sonification is the representation of data through sound. It can be a useful addition to visual display. In this video, for example, I think the high demand on the grid during the cold patch in the middle of January is conveyed more strikingly than it would be by a graph. You also get a real sense of the rhythm of the nation's electricity demand.
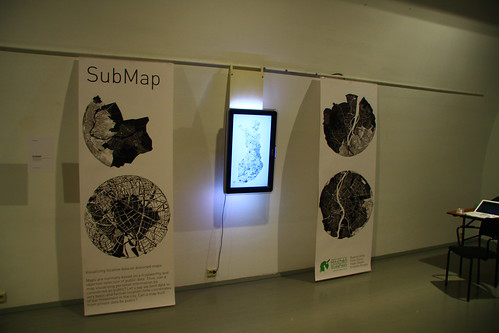
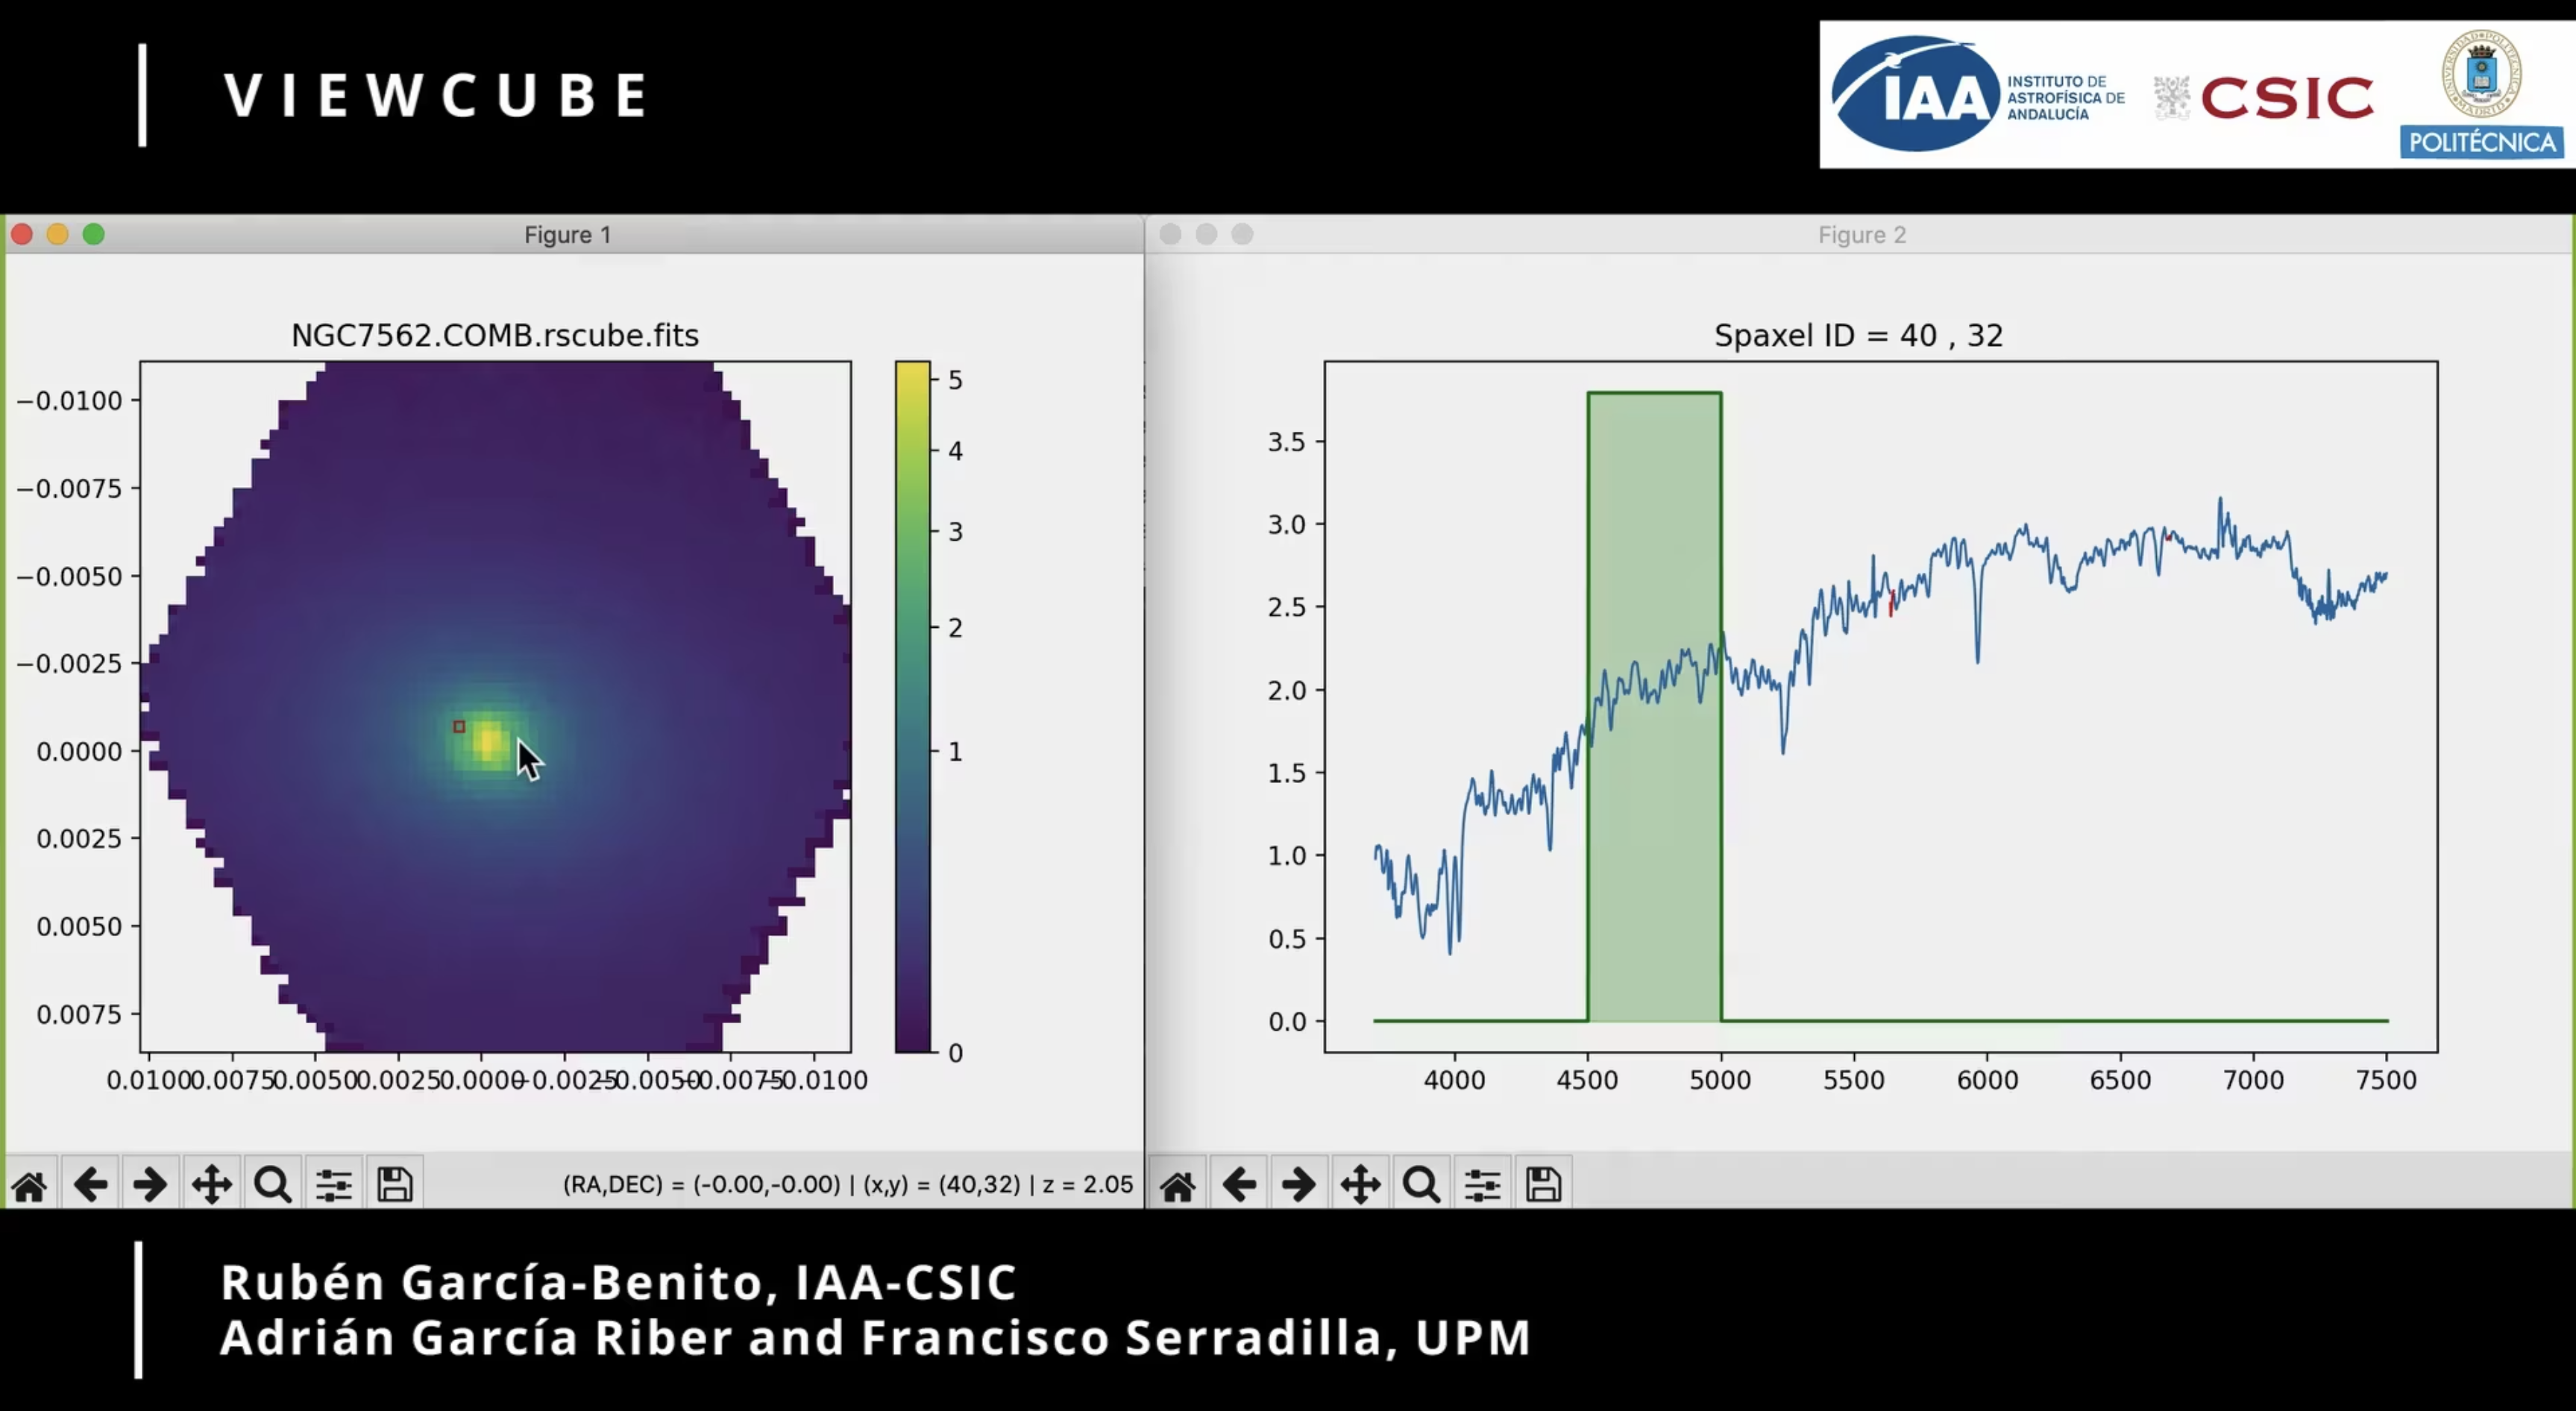
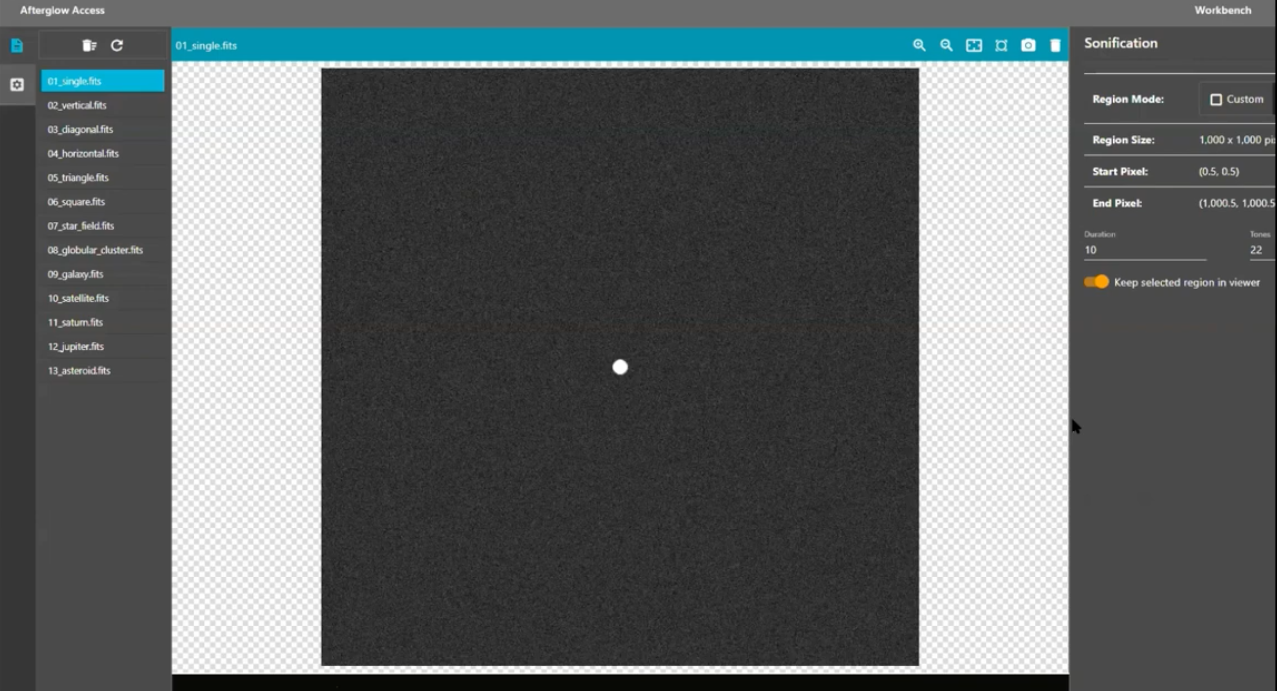
This is an extension to the Astronify* software (https://astronify.readthedocs.io/en/latest/) to allow the sonification of a spatially distributed dataset. In particular, this code was developed as a master project from Durham University to sonify muon images from the VERITAS Array.


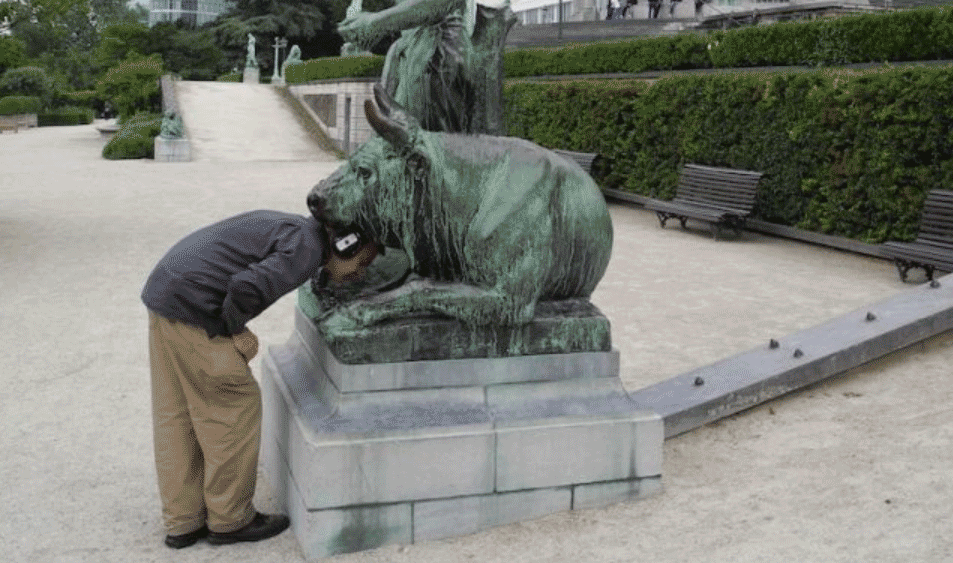
 Human Orangutan.png)


.png)

.png)